Warehouse Insights for Business Central

Warehouse Insights for Microsoft Dynamics 365 Business Central
Optimise Warehouse Operations with Power BI Reporting
Business Central Insights Warehouse Insights provides complete visibility into warehouse activity, storage capacity, replenishment, inventory movement and employee productivity.
Built specifically for Microsoft Dynamics 365 Business Central, the app turns operational warehouse data into interactive Power BI reports that help businesses identify issues earlier, improve productivity and make better use of warehouse space.
Warehouse Insights supports both basic warehouse configurations and advanced environments using Directed Put-away and Pick. It brings together information from across your locations, zones, bins, items and warehouse employees in one professionally maintained reporting solution.
Warehouse Insights Complete App Overview
The Warehouse Insights overview introduces the complete reporting app and provides a quick look at each report.
The app helps warehouse and operations teams:
Monitor picking, put-away and warehouse activity
Identify empty bins and replenishment requirements
Measure warehouse capacity by weight and cubage
Analyse stock movement and inventory velocity
Compare warehouse performance over time
Evaluate employee workload and productivity
Identify slow-moving, obsolete and poorly positioned inventory
Use the overview to understand how the reports work together before exploring each report in more detail below.
 The complete tutorial series explains how to use each of the flexible self-service reports and the purpose-built operational pages included in Warehouse Insights in more depth.
Warehouse Insights Report Tutorials
Warehouse Overview
The Warehouse Overview is the at-a-glance starting point for analysing warehouse performance.
Choose a warehouse measure from the selector and the entire page updates to show that metric from several perspectives. You can review performance over time, compare locations and then break the result down by item, bin and warehouse employee.
The report can be used to analyse measures covering:
Picking and put-away activity
Quantities handled
Warehouse entries and inventory movements
Weight and cubage
Adjustments
Employee activity and workload
Every visual cross-filters the others. Selecting a warehouse, item, bin or employee immediately updates the rest of the report, allowing you to move from a high-level view into a specific area of warehouse activity.
Warehouse Table
The Warehouse Table is a flexible self-service report that lets you build your own warehouse analysis.
Choose the measures you want to review and the dimensions by which they should be broken down. Each selected measure becomes a separate column, allowing multiple warehouse KPIs to be compared side by side.
For example, you could analyse:
Pick lines and quantities picked by item
Stock levels by location, zone and bin
Warehouse activity by employee
Bin capacity by weight and cubage
Inventory movement and aging
You can add multiple dimensions to create drillable hierarchies, such as:
Location → Zone → Bin → Item
Preset bookmarks provide useful starting points for common analysis:
Bin Contents
Capacity and Space
Activity and Throughput
Aging
Bill of Materials Structure
The Warehouse Table helps users answer new operational questions without exporting data or building another report.
Warehouse Cube
The Warehouse Cube extends the flexibility of the Warehouse Table by adding a configurable column axis.
Select your measures, rows and columns to create a pivot-style view that compares two warehouse dimensions simultaneously. Multiple fields can be added to either axis to create expandable reporting hierarchies.
For example, you could compare:
Warehouse activity by employee and month
Items by location and bin
Item categories by warehouse zone
Capacity utilisation by location and bin type
Pick demand by item and period
Preset views provide quick access to common areas of analysis:
Slotting Health
Weight versus Volume
Replenishment
Dead and Slow-moving Stock
Capacity Hotspots
Activity trends and Team Workload
Adjustments
Expiry Risk
The Warehouse Cube is useful when you need to understand how two different parts of the warehouse operation interact.
Warehouse by Period
The Warehouse by Period report lets you analyse any selected warehouse measure across time.
Measures can be grouped by:
Year
Quarter
Month
Week
Day
Expiration Date
Pick Aging Group
The report displays the underlying figures in a table and presents the trend visually beneath it, making changes, spikes and declines easier to identify.
Use this page to answer questions such as:
Is warehouse activity increasing?
Are picking volumes seasonal?
When did a stock or capacity issue begin?
Is old picking demand accumulating?
Which inventory is approaching expiry?
Warehouse over Comparison Period
The Warehouse over Comparison Period report compares a current period against another selected period.
Choose a measure, set your current and comparison dates and select the dimensions you want to analyse. The report calculates the variance and clearly shows whether activity has increased or decreased.
It can be used to compare:
This month against last month
One quarter against the previous quarter
The current period against the same period last year
Performance before and after an operational change
Preset bookmarks act as an early-warning system for:
Stock-level drops and spikes
Shipment and receipt declines
Bin weight and cubage spikes
Pick-demand increases and decreases
Newly empty bins
Picker-output declines
Picker-load spikes
The default threshold is 20%, but this can be adjusted to reflect the level of change that is meaningful to your organisation.
Bin Replenishment
The Bin Replenishment report provides a practical daily action list for warehouse supervisors.
Bin contents are divided into four operational categories:
Empty
Below Minimum
Within the Minimum–Maximum range
Above Maximum
Headline KPIs show:
The percentage of bin contents requiring replenishment
The quantity required to restore bins to their minimum
Overstock quantities currently above maximum levels
The report can be analysed by location, zone, bin and item, helping warehouse teams prioritise where replenishment is needed most.
This helps prevent pickers arriving at empty pick faces while also identifying excess inventory occupying valuable picking space.
Capacity Utilisation
The Capacity Utilisation report shows how effectively warehouse space is being used.
It compares the contents of warehouse bins against their configured capacity using:
Weight
Cubage or volume
Bin occupancy
Capped utilisation
Uncapped utilisation
Capped utilisation provides a percentage up to 100%, while uncapped utilisation reveals the full extent to which a bin may have exceeded its configured capacity.
Use the report to identify:
Bins approaching capacity
Bins already over capacity
Underutilised warehouse space
Locations constrained by weight
Locations constrained by volume
Differences between warehouses, zones and bin types
Warehouse Velocity Heatmap
The Warehouse Velocity Heatmap helps determine whether inventory is stored in the most appropriate warehouse locations.
It compares item movement and picking activity against bin ranking, making it easier to identify:
Fast-moving items stored in low-ranking bins
Slow-moving items occupying premium picking locations
Stock placement that may increase picker travel
Warehouse slotting that no longer reflects demand
The heatmap can be reviewed at item-category level and expanded to individual items.
This supports re-slotting decisions and helps place frequently picked products in more efficient warehouse positions.
ABC Classification
The ABC Classification report applies Pareto-style analysis to warehouse inventory.
Items are ranked according to a selected warehouse measure and divided into three groups:
A items: the items responsible for the first 70% of activity
B items: the items responsible for the next 25%
C items: the items responsible for the final 5%
The default classification measure is the number of pick lines, although alternative measures can be selected.
The report helps identify the relatively small group of items responsible for most warehouse activity. These products may require:
More accessible storage locations
Greater replenishment priority
Closer stock-availability monitoring
Different minimum and maximum quantities
Additional picking capacity
It can also highlight low-activity inventory occupying valuable warehouse space.
Warehouse Entries and Transaction-Level Detail
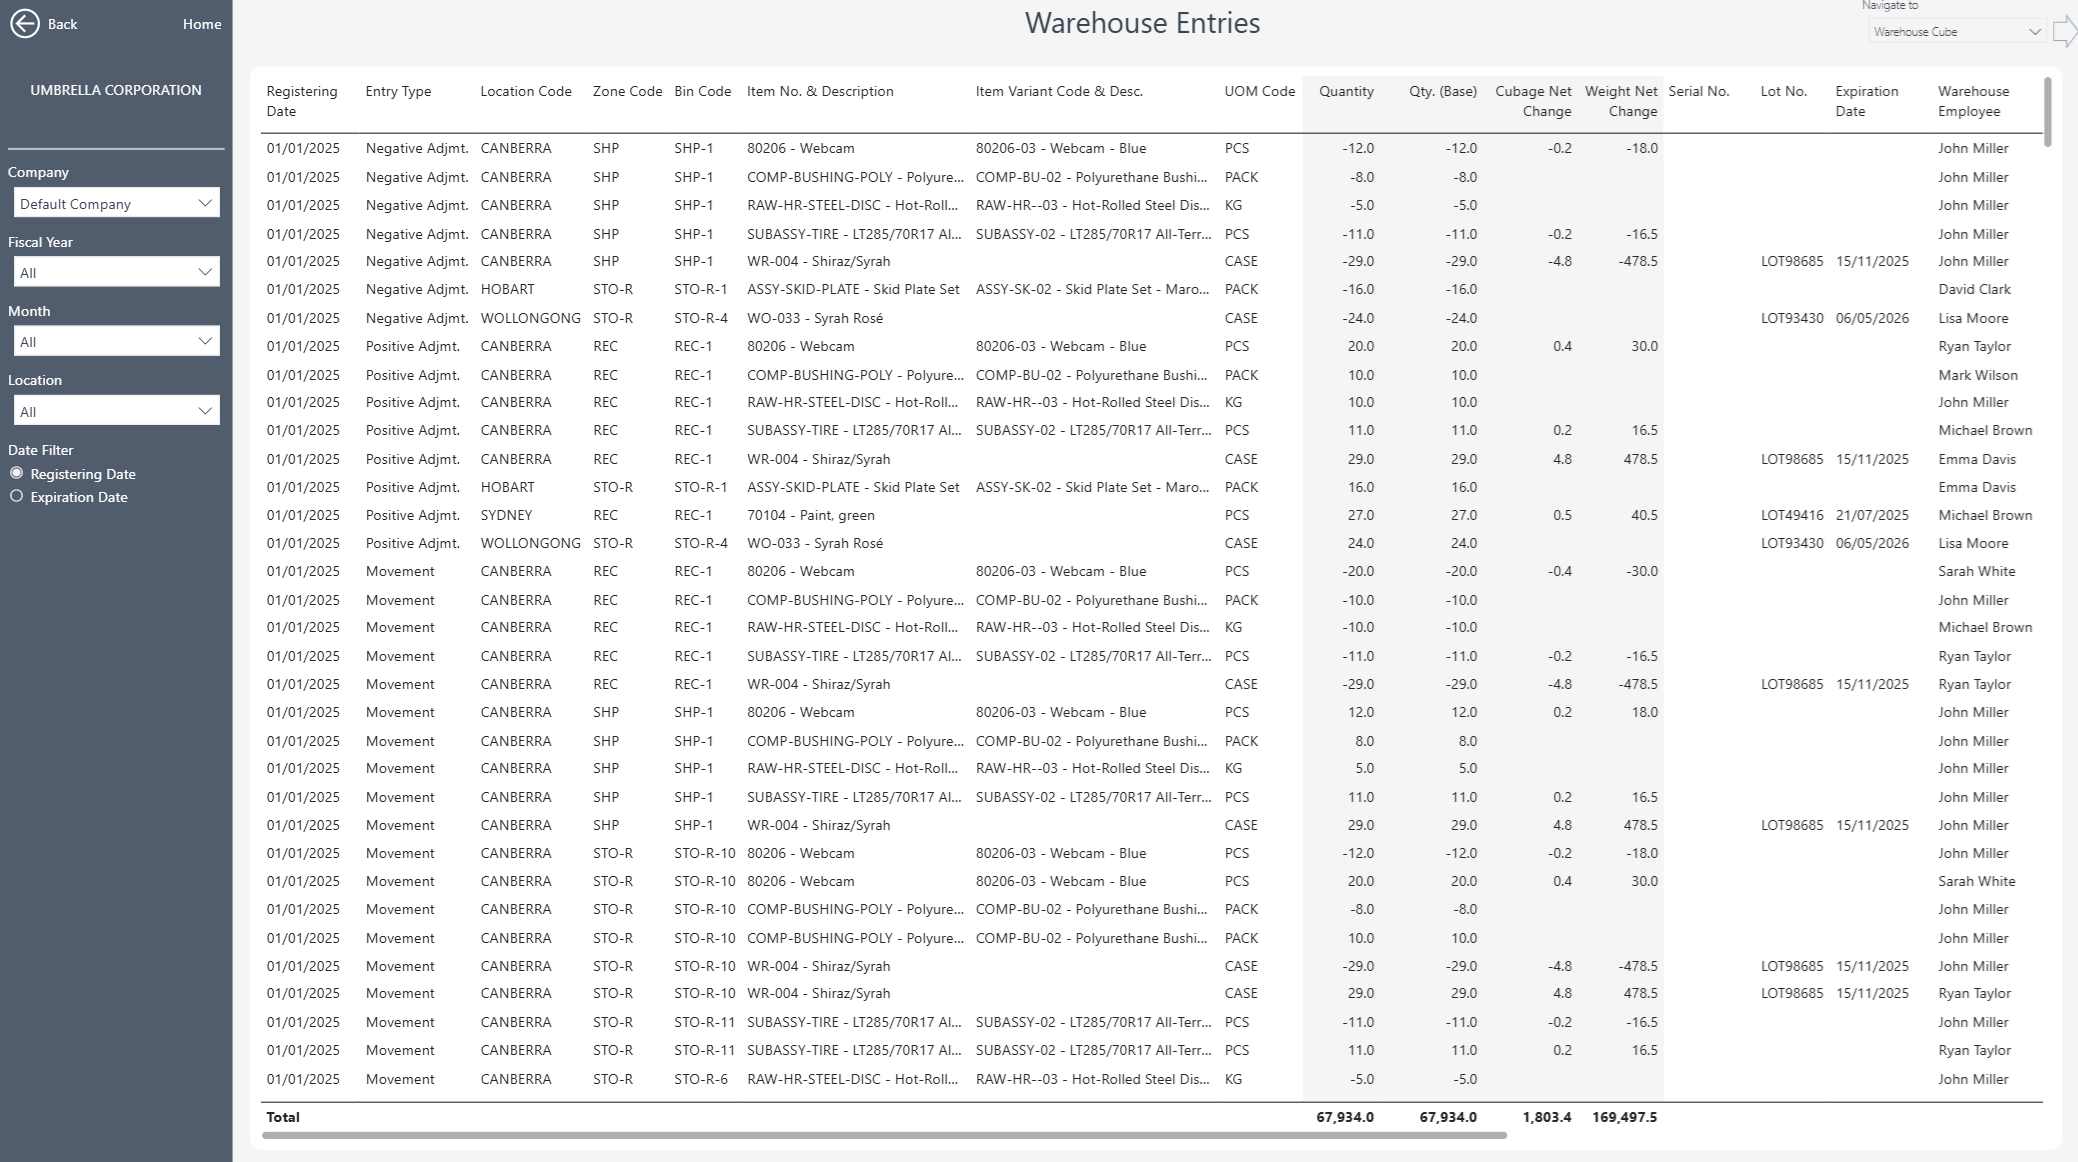
Warehouse Insights allows users to move beyond headline measures and inspect the transactions behind the result.
From supported report visuals, users can drill through to individual warehouse entries and investigate the activity contributing to a KPI, trend or exception.
This provides the context needed to examine unusual quantities, inventory adjustments, activity spikes and employee performance without leaving the reporting experience.
What Can Warehouse Insights Help You Answer?
Warehouse Insights helps warehouse and operations teams answer questions including:
Which warehouse locations are operating most efficiently?
Which bins are underutilised or approaching capacity?
What inventory requires replenishment?
Which items move fastest through the warehouse?
Where are operational bottlenecks occurring?
How effectively is warehouse capacity being used?
How productive are warehouse teams and employees?
Which inventory is becoming slow-moving or obsolete?
Gain Greater Control of Your Warehouse Operations
Warehouse Insights transforms Microsoft Dynamics 365 Business Central warehouse data into actionable Power BI reporting.
The app helps businesses improve productivity, optimise storage space, prevent replenishment issues and make better operational decisions.
Whether you manage a single warehouse or multiple locations, Warehouse Insights provides the visibility needed to understand performance and take action sooner.