BCI vs Standard Business Central Reporting
Explore how Business Central Insights transforms reporting into a fully interactive, multi-dimensional analytics experience across finance and operations.

Turning Data into Decisions with Business Central Insights
Business Central Insights transforms reporting into a fully interactive, real-time analytics experience, enabling organisations to move beyond static data and manual processes.
Built directly on Microsoft Dynamics 365 Business Central, it provides a single, trusted reporting layer where users can explore data across companies, dimensions, currencies, and time. Instead of exporting and reconciling data in spreadsheets, teams can analyse performance instantly, drill into detail, and uncover the drivers behind the numbers.
This page demonstrates how Business Central Insights elevates reporting into a more powerful, flexible, and decision-driven experience, helping organisations gain clarity, improve performance, and make faster, more confident decisions.
Business Outcomes with Business Central Insights
Business Central Insights enables organisations to turn data into decisions by delivering outcomes that go beyond standard reporting. BCI is a solution that drives measurable business improvements across finance, operations, for business users and leadership.
Key outcomes include:
Actionable insights for every user - Customisable reports for each business function, role, and user ensure insights are relevant and drive decisions, not just data consumption.
Unified view across entities - Gain a holistic view of key business metrics across companies, environments, and currencies in real time.
Configurable, scalable reporting - A reporting suite that grows with your business; out-of-the-box value with room to evolve through deeper customisation as needs mature.
Faster, more confident decisions - Replace manual spreadsheets and disconnected systems with live, trustworthy data refreshed automatically.
Financial accuracy and control - Consolidated reporting, clear variance analysis, and alignment between Power BI and Business Central ensure data integrity.
Operational efficiency - Identify bottlenecks, monitor performance, and uncover trends across sales, purchasing, inventory, manufacturing, and projects.
Empowered teams - Enable self-service analysis for business users while maintaining security and governance through predefined roles and row-level permissions.
Reduced reporting overhead - Eliminate manual data manipulation and save hours weekly across departments with ready-made, plug-and-play reports.
Strategic insight for leadership - Deliver interactive dashboards and KPIs that align to business goals, helping management steer performance proactively.
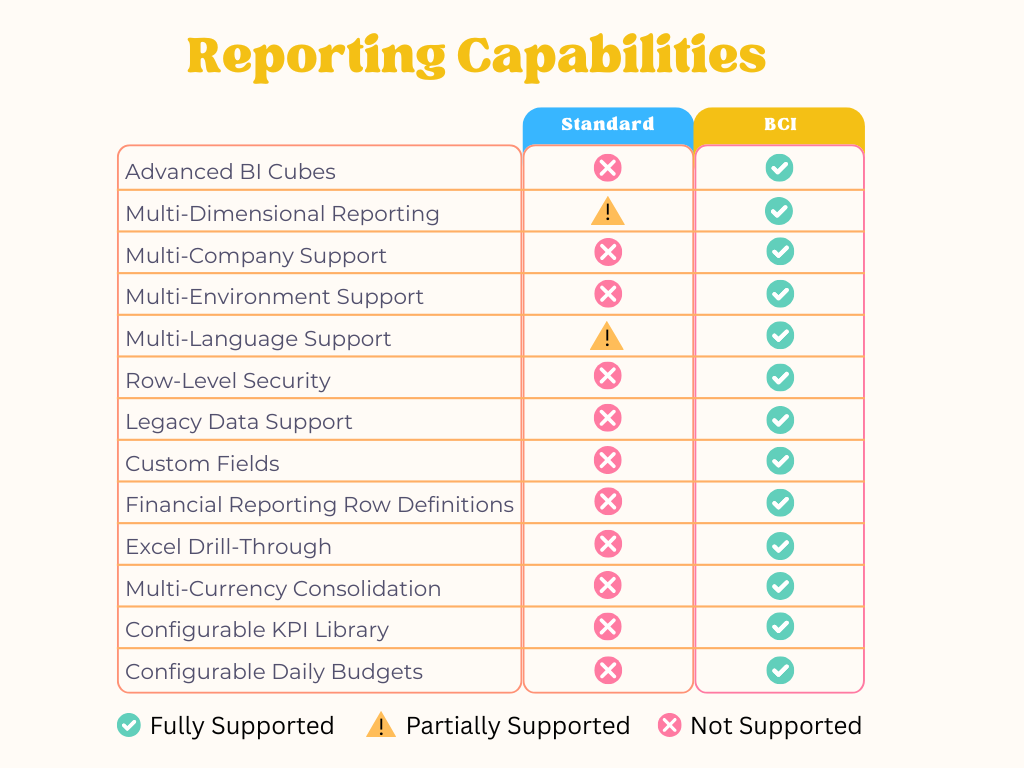
Key Differentiators of Business Central Insights
Advanced Analytics Architecture, Financial Intelligence and Control
Microsoft’s free Power BI apps offer a starting point for Business Central reporting. Business Central Insights builds on that foundation with comprehensive analytics, financial intelligence, and configurable reports designed for every role and business area.
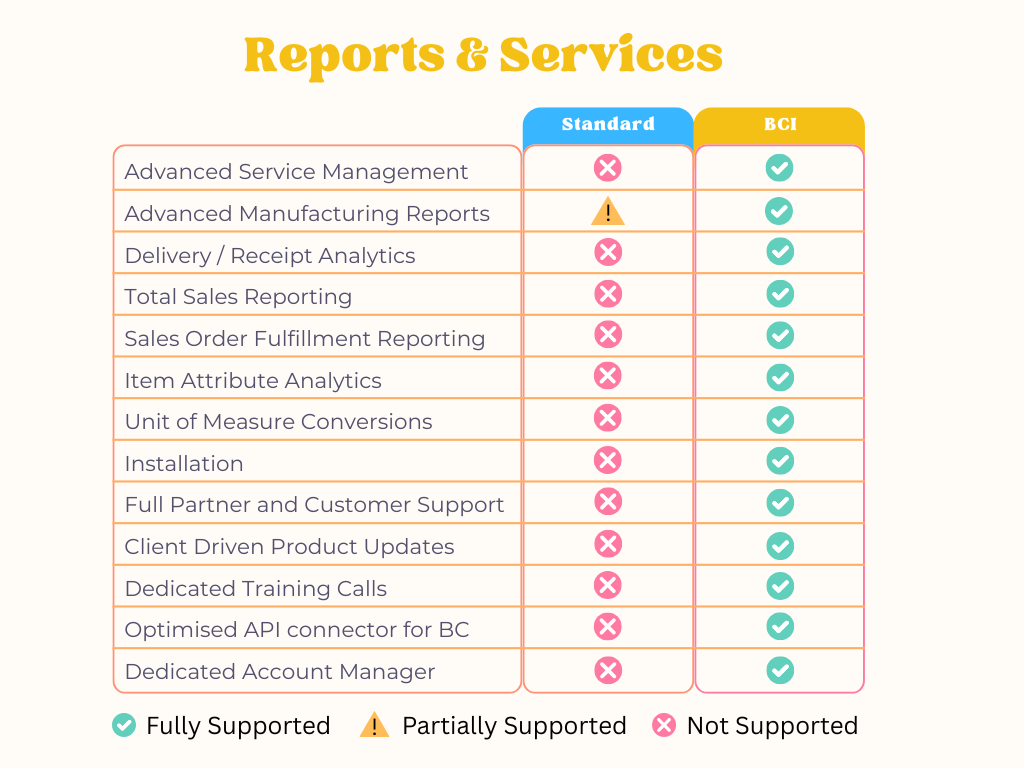
Operational Intelligence and Value Proposition
This chart outlines how Business Central Insights extends Microsoft’s standard Power BI reports with operational analytics, partner enablement, and value-added support. BCI helps partners deliver faster insights, scalable reporting, and stronger customer retention through ready-made dashboards across all business areas.
 If you’d like to explore these topics in greater detail, head over to our onboarding page for setup, training and all the guiding resources: https://businesscentralinsights.com/onboarding
Visual Comparisons
Standard Income Statement by Month
A simple, easy-to-read statement showing G/L account balances across fiscal years (not by month). Ideal for quick financial reference, though not designed for deeper performance analysis or month-level insights.
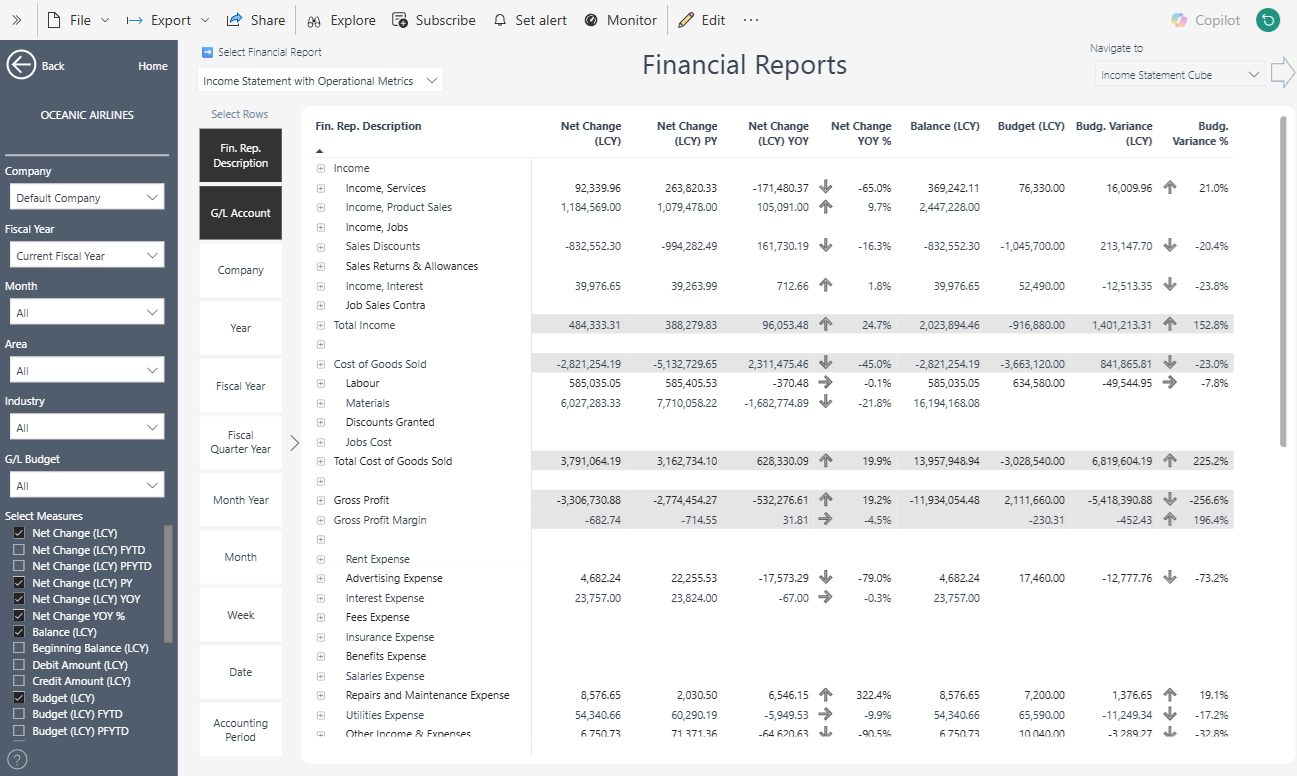
 Business Central Insights Financial Reporting
Mirrors the structure of the configured Financial Reports within Business Central, ensuring complete alignment between ERP and Power BI reporting. It’s fully interactive, allowing users to slice and filter by company, period, or dimension while toggling between multiple measures such as Net Change, YOY %, Budget, and Variance. Statistical elements can also be added, for example, analysing profit by cost centre or employee, transforming the income statement into a powerful, interactive performance management tool that provides both financial and operational insights.
 Standard Sales Overview
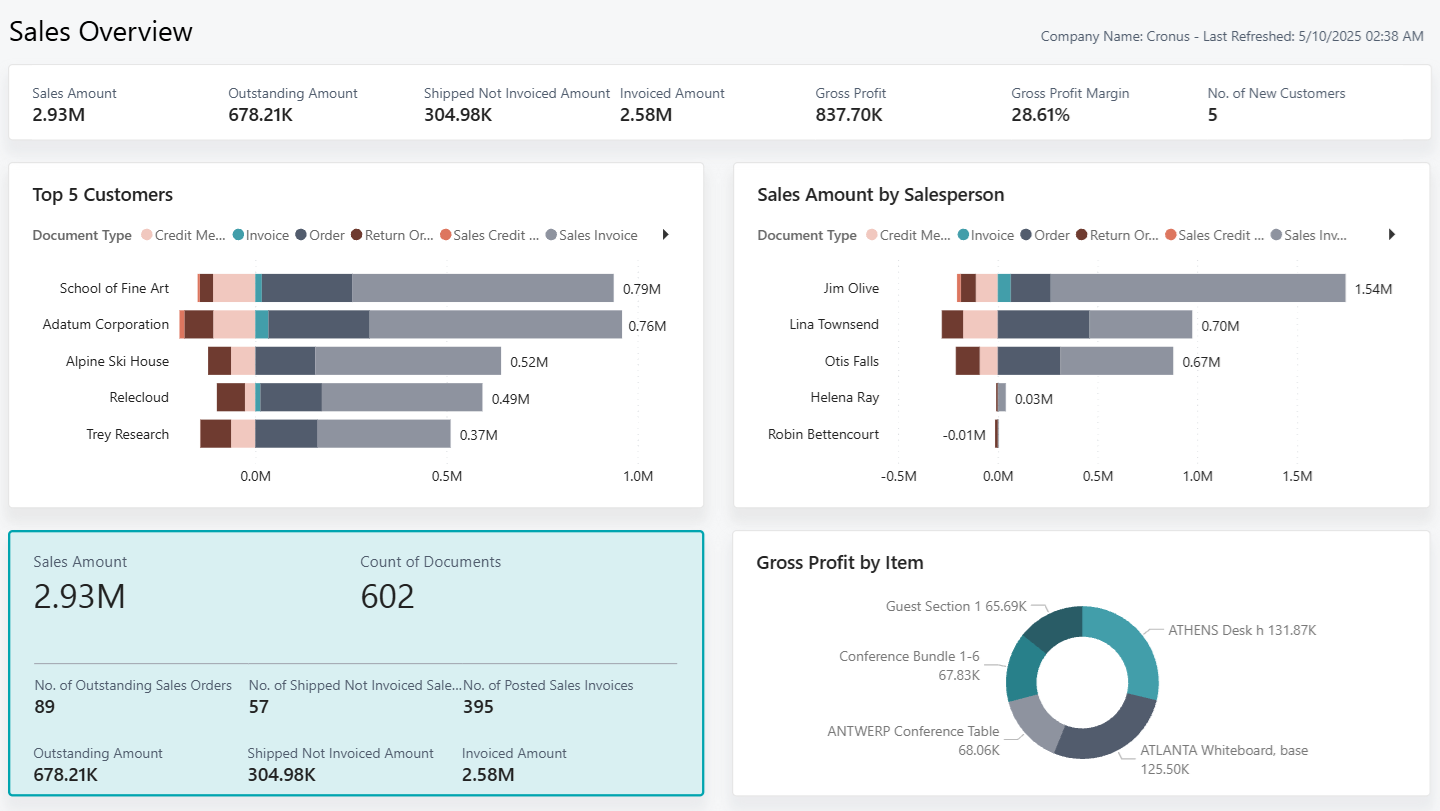
Gives a helpful top-level view of sales amounts, key customers, and salesperson performance. While suitable for quick checks, it offers only light interactivity and limited flexibility for deeper analysis or multi-dimensional exploration.
 Business Central Insights Total Sales Overview
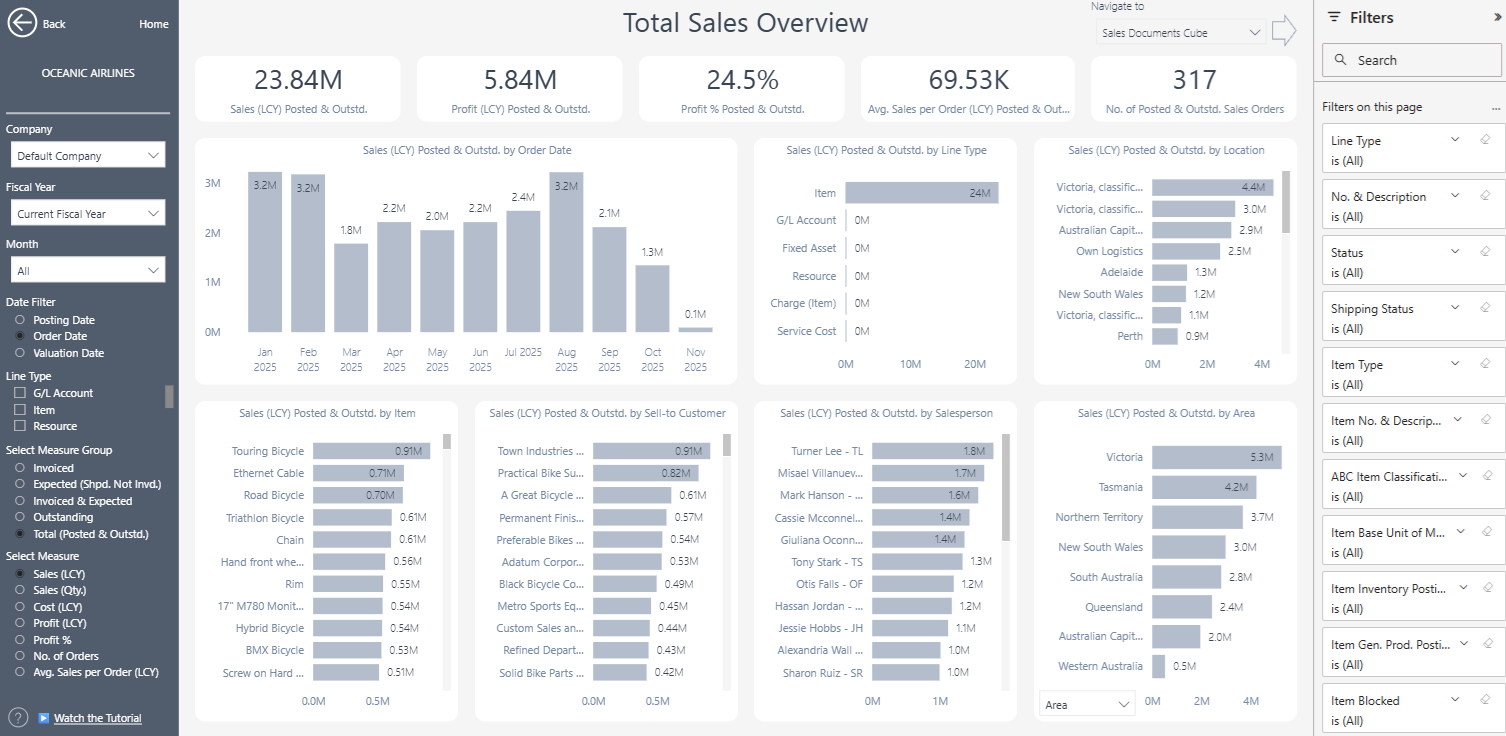
A polished, enterprise-level dashboard experience, combining dozens of key measures such as sales amount, gross profit, invoiced, expected or outstanding transactions. Users can slice and dice data by item, customer, salesperson, company, or period, apply advanced filters instantly, and explore the data from multiple perspectives.
 Standard Inventory by Item
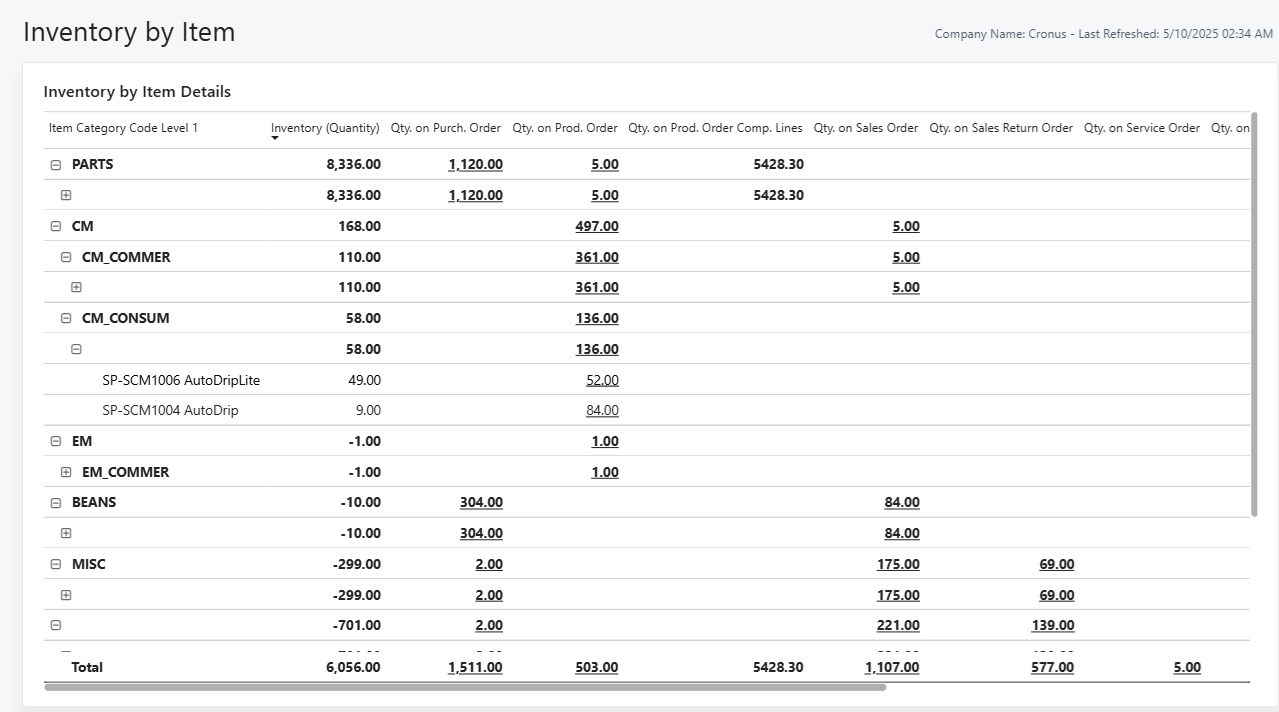
A simple, easy-to-read view of item quantities and outstanding transactions. Ideal for quick stock checks, though not designed for deeper operational or financial analysis.
 Business Central Insights Inventory Table
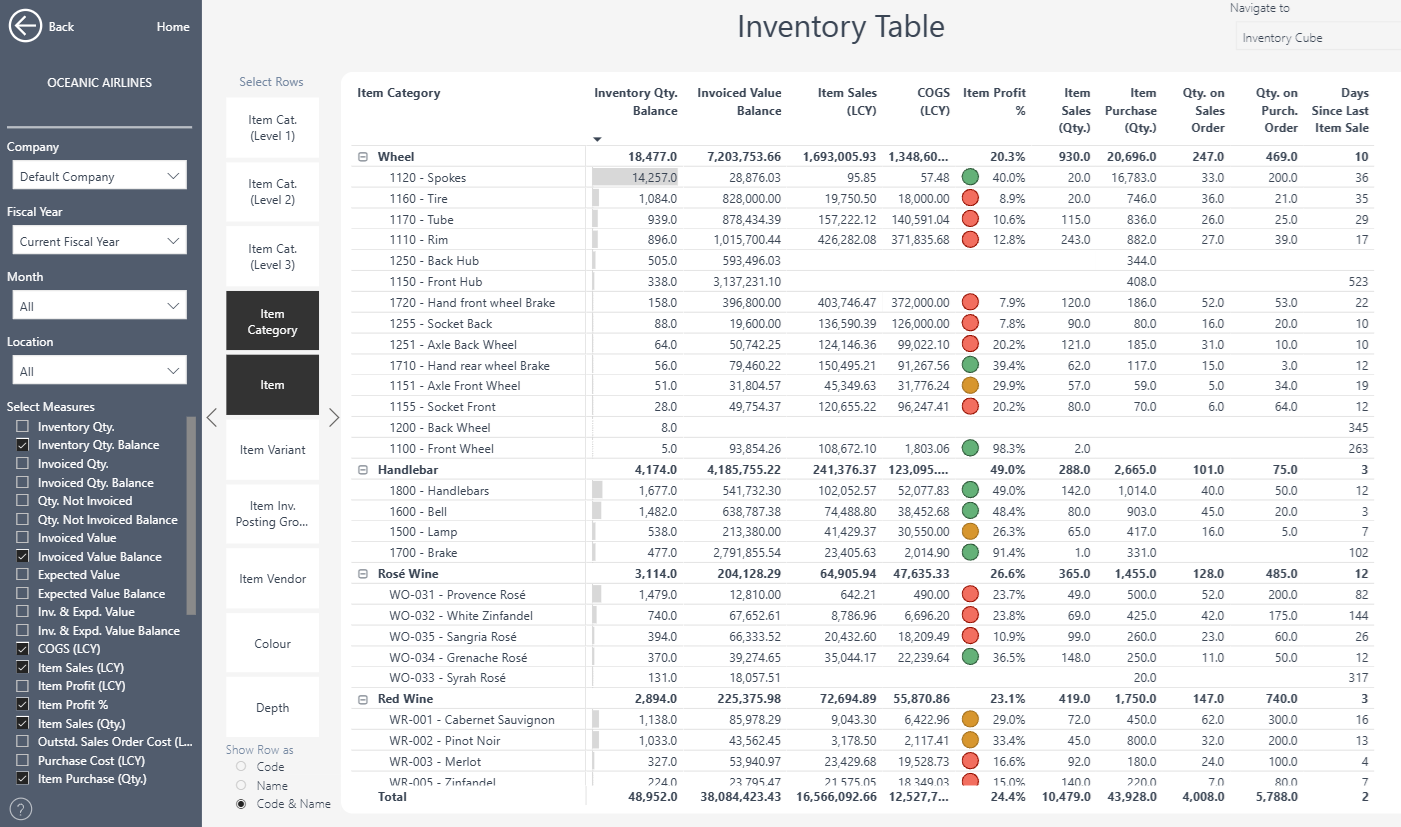
Fully interactive analysis experience, combining financial and operational measures such as inventory value, sales, COGS, and profit %. Users can slice and filter by company, item category, item, location, or period, and drill down through multiple hierarchy levels. With configurable measures, visual profit indicators, and multi-company, multi-dimensional capability, it transforms inventory reporting into a dynamic performance and margin analysis tool.
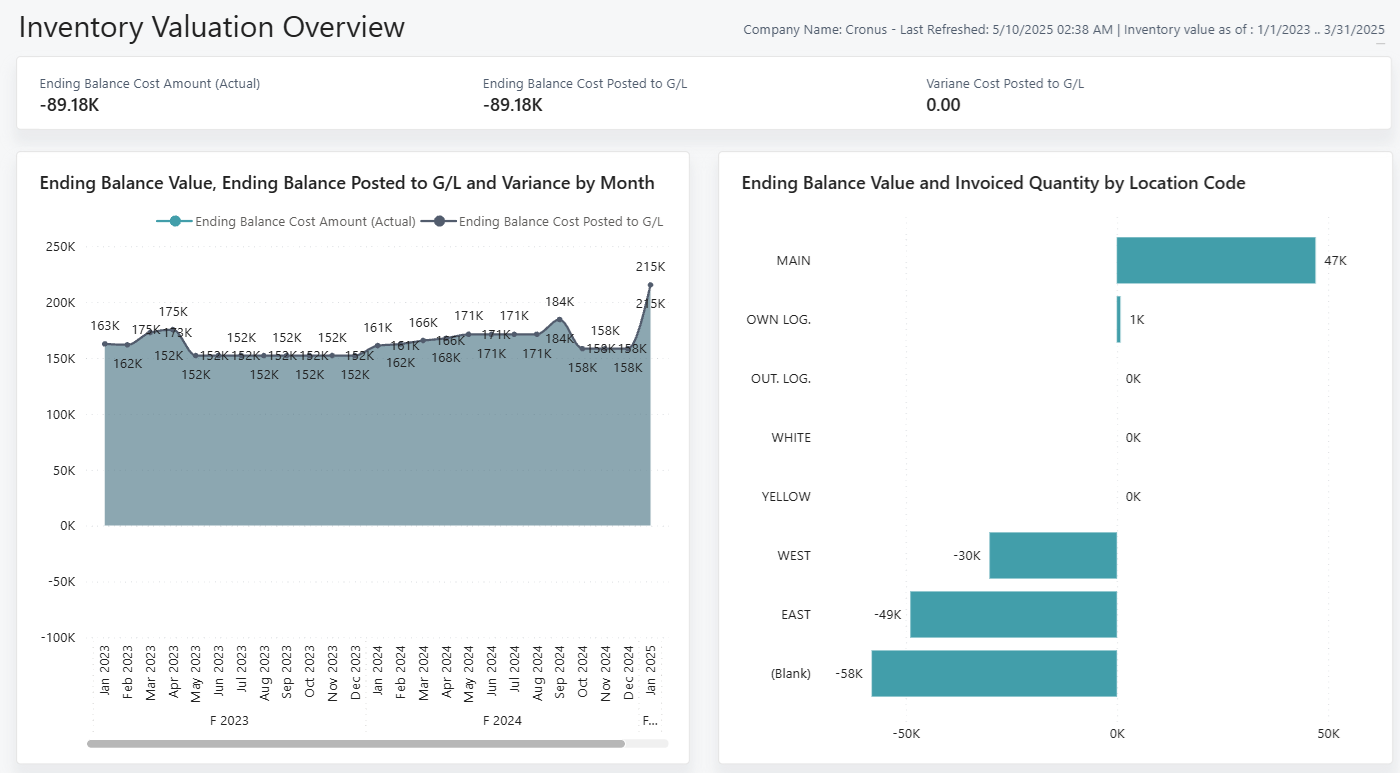
 Standard Inventory Valuation
Provides a structured month-end view of inventory balances with basic insights into opening, increases, decreases, and closing values. The layout is limited, with minimal interactivity and no easy way to explore trends or drill deeper into value movements.
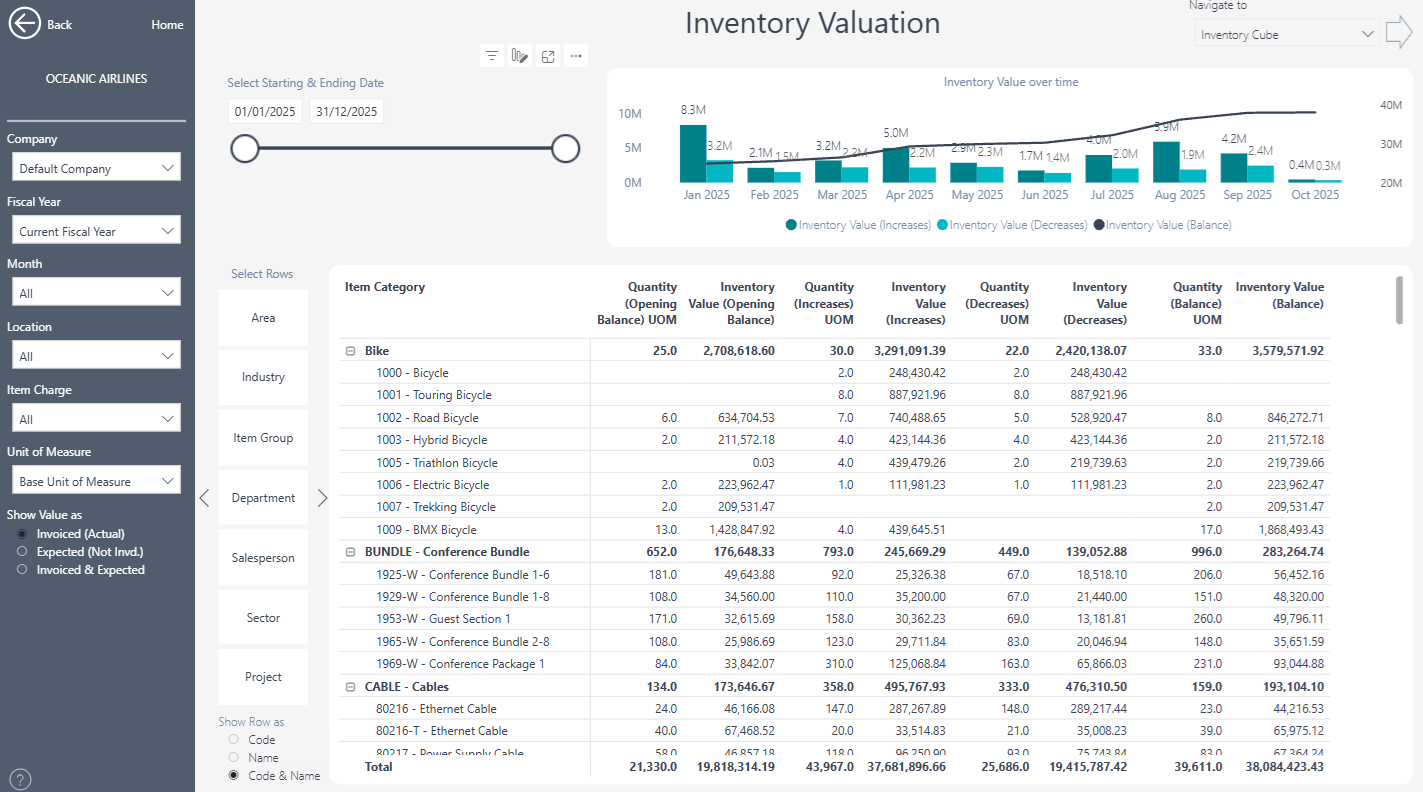
 Business Central Insights Inventory Valuation
Delivers a much richer, fully interactive valuation experience, combining financial and operational insight in one place. Users can slice by company, period, location, item category, or any dimension, drill into underlying value and quantity movements, and quickly understand what’s driving changes over time. Trend visuals, reconciliation metrics, and multi-level drill-throughs provide complete transparency, transforming inventory valuation from a static month-end report into a dynamic analysis tool for both finance and operations.
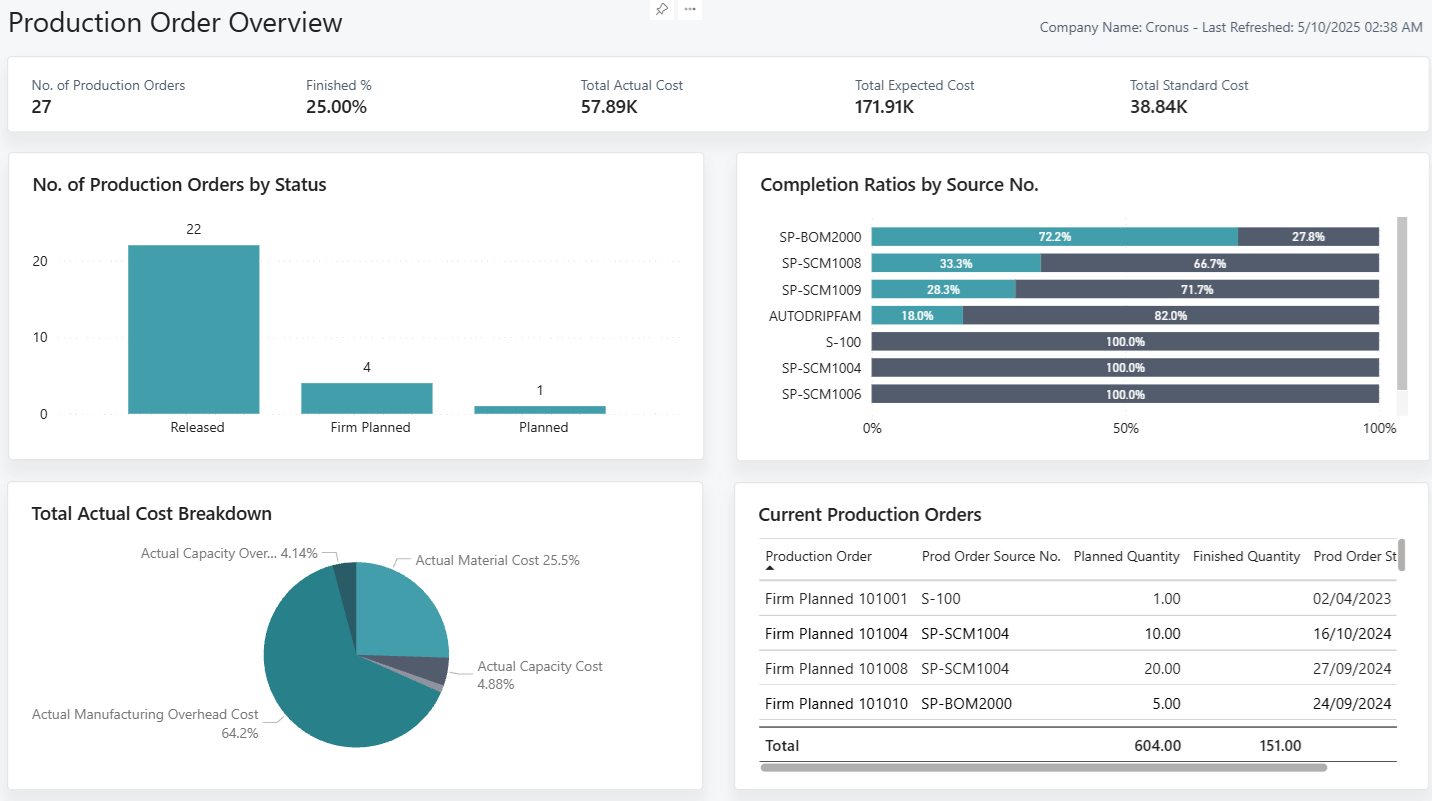
 Standard Production Overview
Basic summary of production orders, costs, and completion ratios, but offers limited flexibility for analysis across locations, items, or time periods. It’s useful for a quick operational snapshot but lacks interactivity and deeper insights.
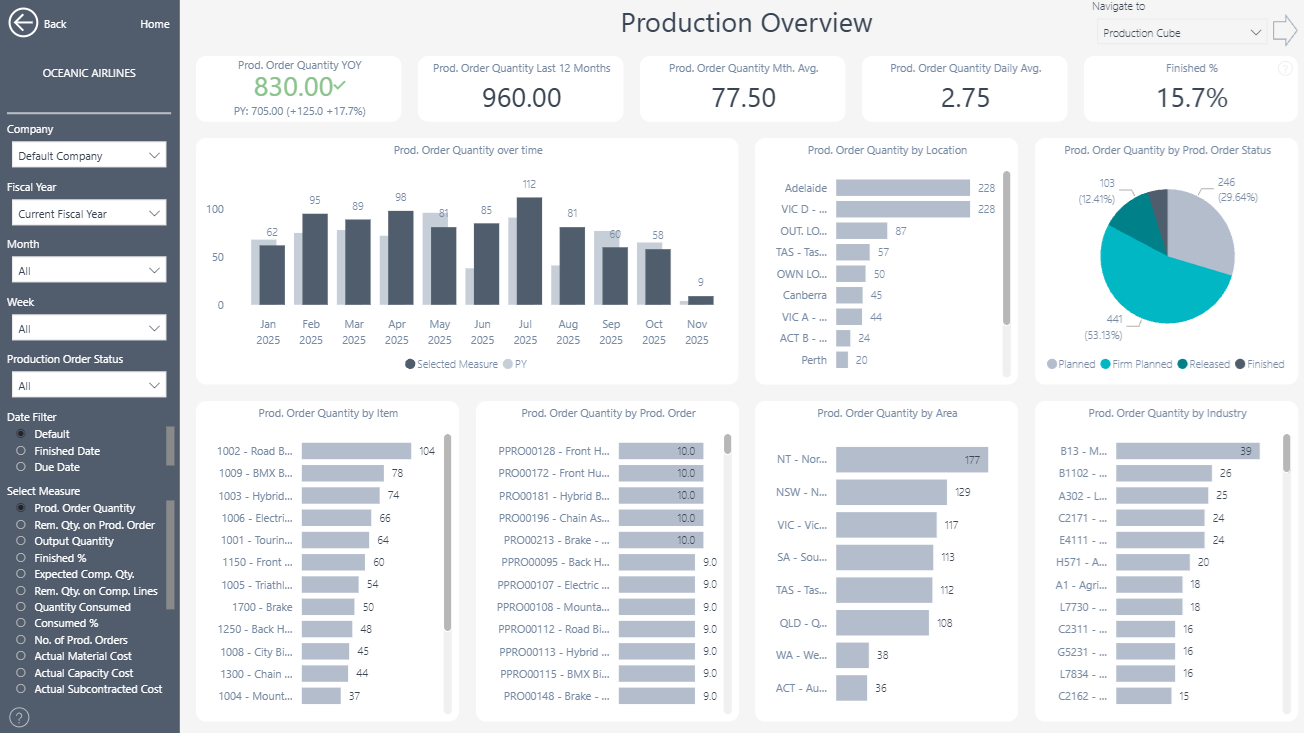
 Business Central Insights Production Overview
A comprehensive, interactive analytics experience covering the full production process. Users can filter by company, period, location, item, or status and analyse measures such as quantities, throughput, efficiency, and completion rates. With visual breakdowns by item, area, and industry, along with trend and performance tracking over time, it transforms production reporting into a powerful decision-support tool that highlights productivity, bottlenecks, and profitability drivers.
 Standard Production Routing Gantt
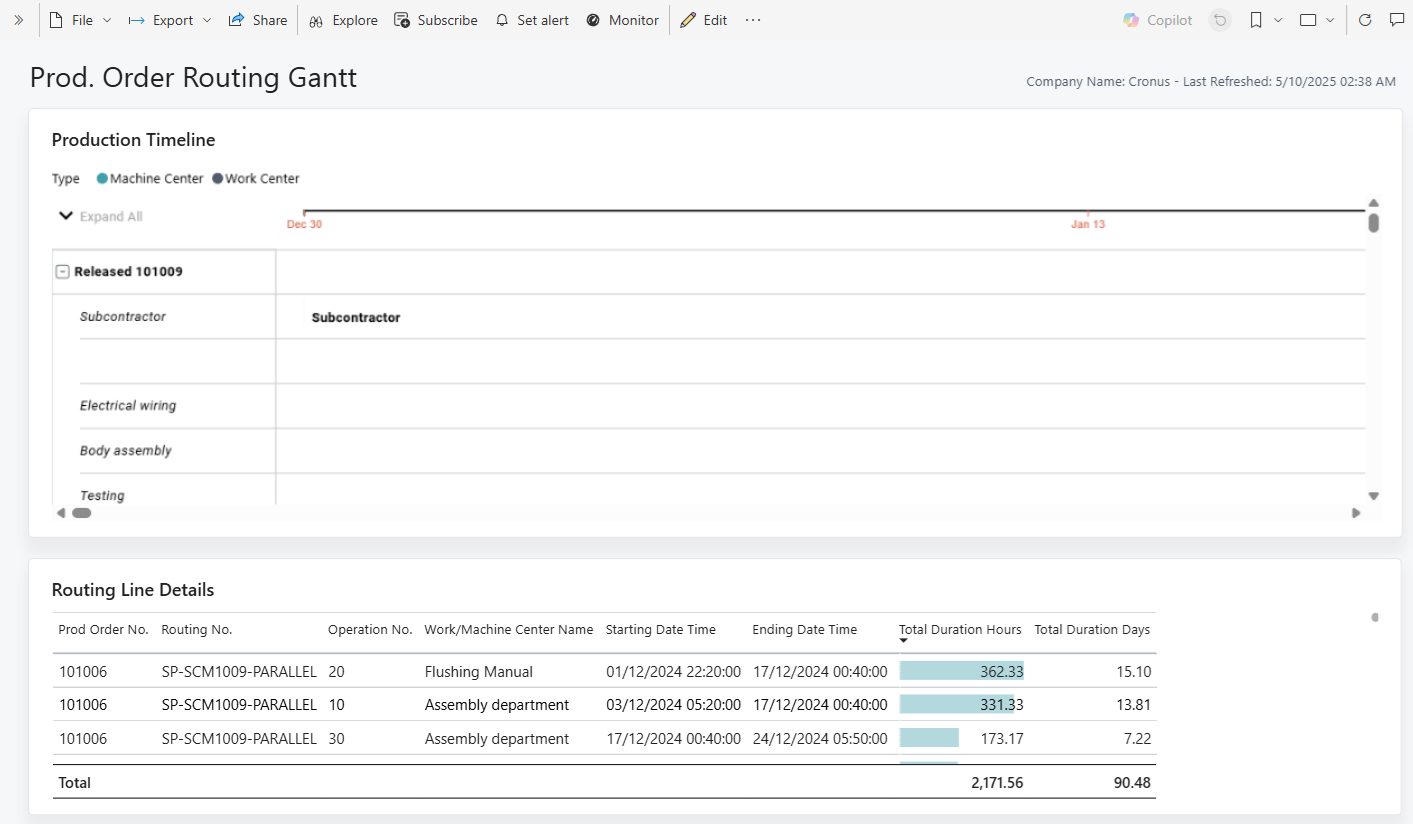
Provides a clear, basic view of routing timelines for individual production orders, showing start and end times and total durations. It’s useful for reviewing the sequence of operations, but interactivity is limited, filtering options are minimal, and it doesn’t provide broader context across work centres, machine centres, or multiple production orders at once.
 Business Central Insights Routing Gantt Chart
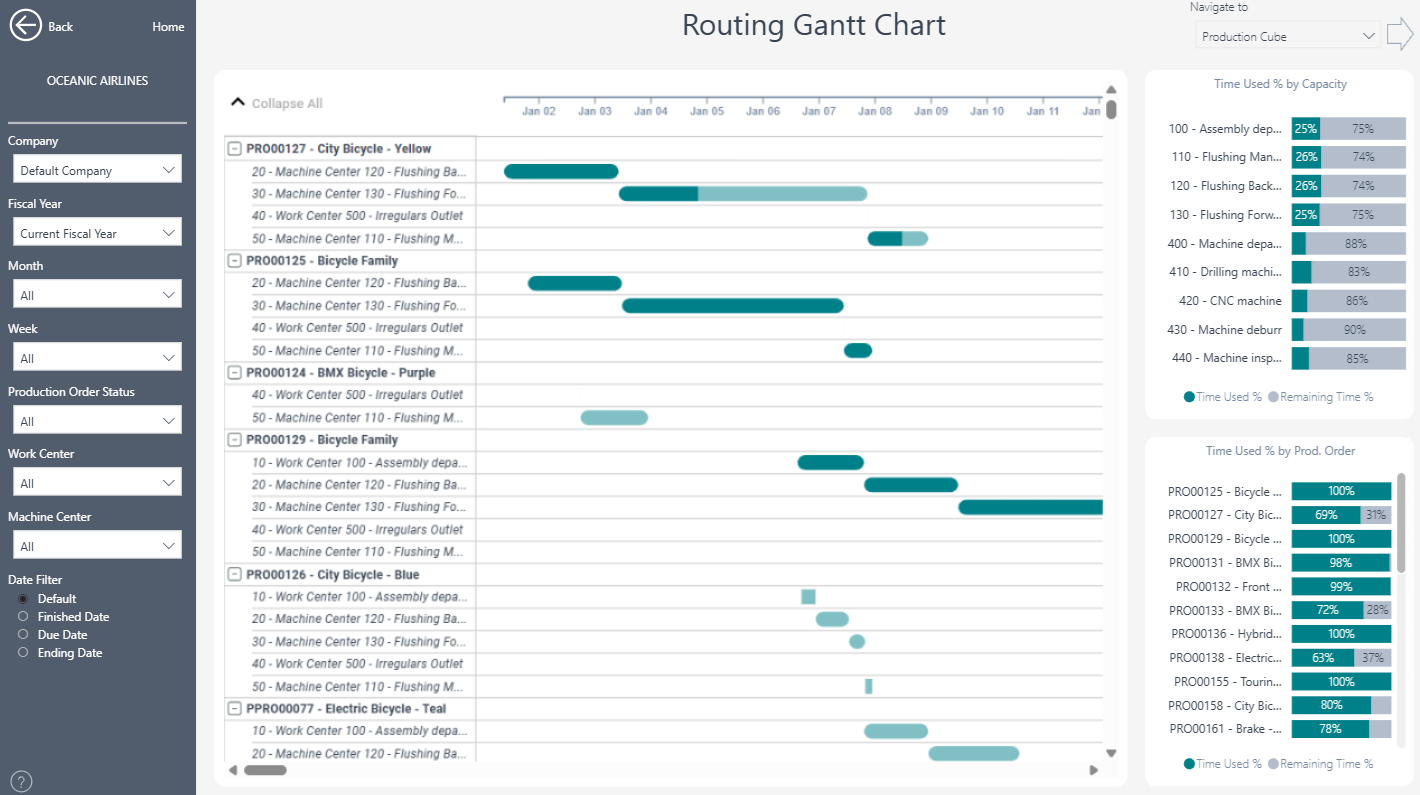
A fully interactive scheduling and capacity-visualisation tool that brings the entire production routing process to life. Users can filter by company, period, work centre, machine centre, production order status, or week, instantly updating the Gantt view. Multiple orders can be reviewed side-by-side, with colour-coded operation bars, capacity indicators, and time-used analysis. Supporting visuals break down utilisation by work centre and by production order, helping teams identify bottlenecks, balance workloads, and improve throughput planning.
 Standard Project Performance to Budget
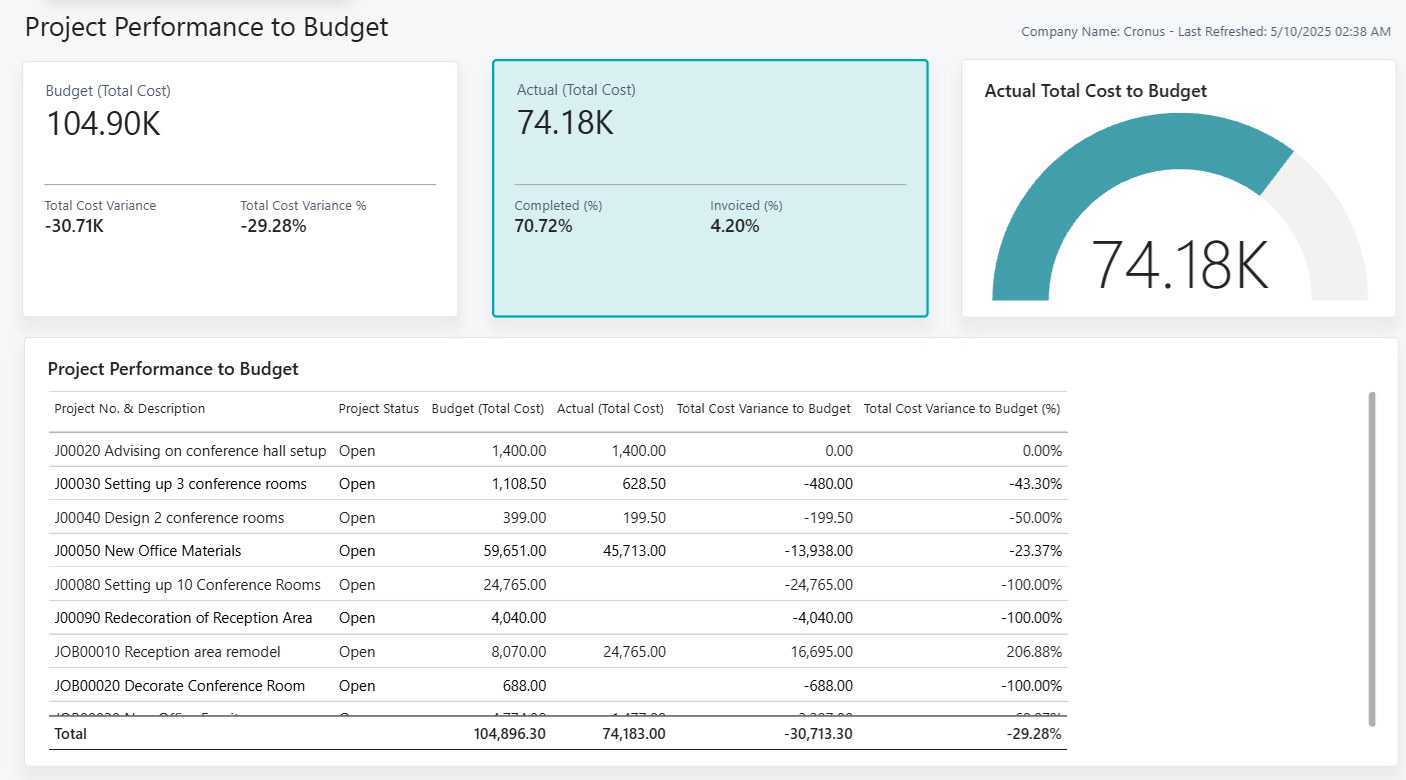
Provides a clear, straightforward summary of budget vs. actual totals, along with simple variance calculations and a list of projects with their associated costs. It’s useful for a quick financial snapshot but offers limited flexibility for deeper analysis across tasks, project managers, customer groups, or different profit measures.
 Business Central Insights Project Actuals vs. Budget
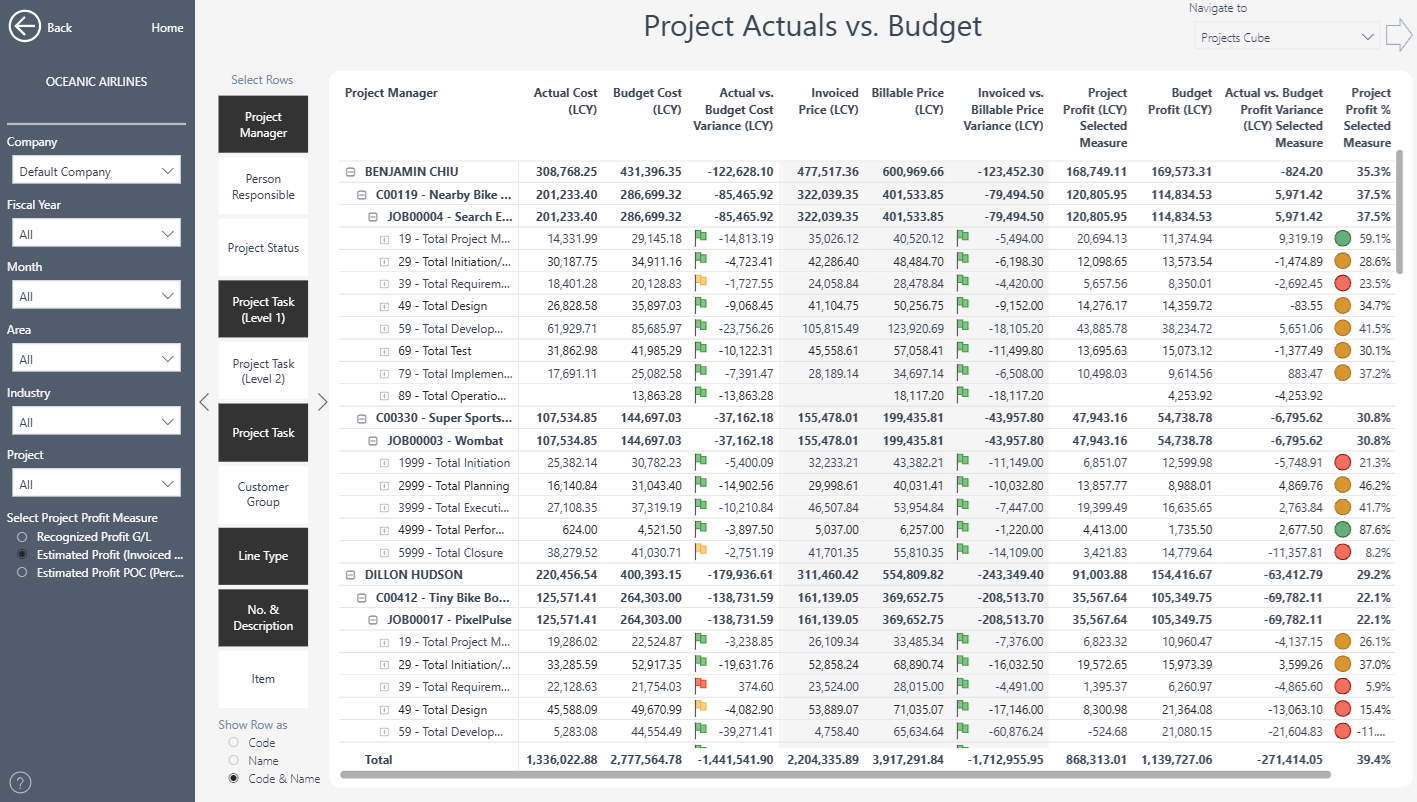
A fully interactive project performance analytics tool that allows users to drill through multiple levels of detail, from project manager, to project, to task. Users can filter by company, period, project status, industry, area, or any dimension and instantly see variances across cost, revenue, billable amounts, profit, and multiple profit measures. With visual indicators for variances, expandable hierarchies, and the ability to analyse recognised, invoiced, or POC-based profit, BCI transforms project reporting into a comprehensive performance and profitability analysis experience.
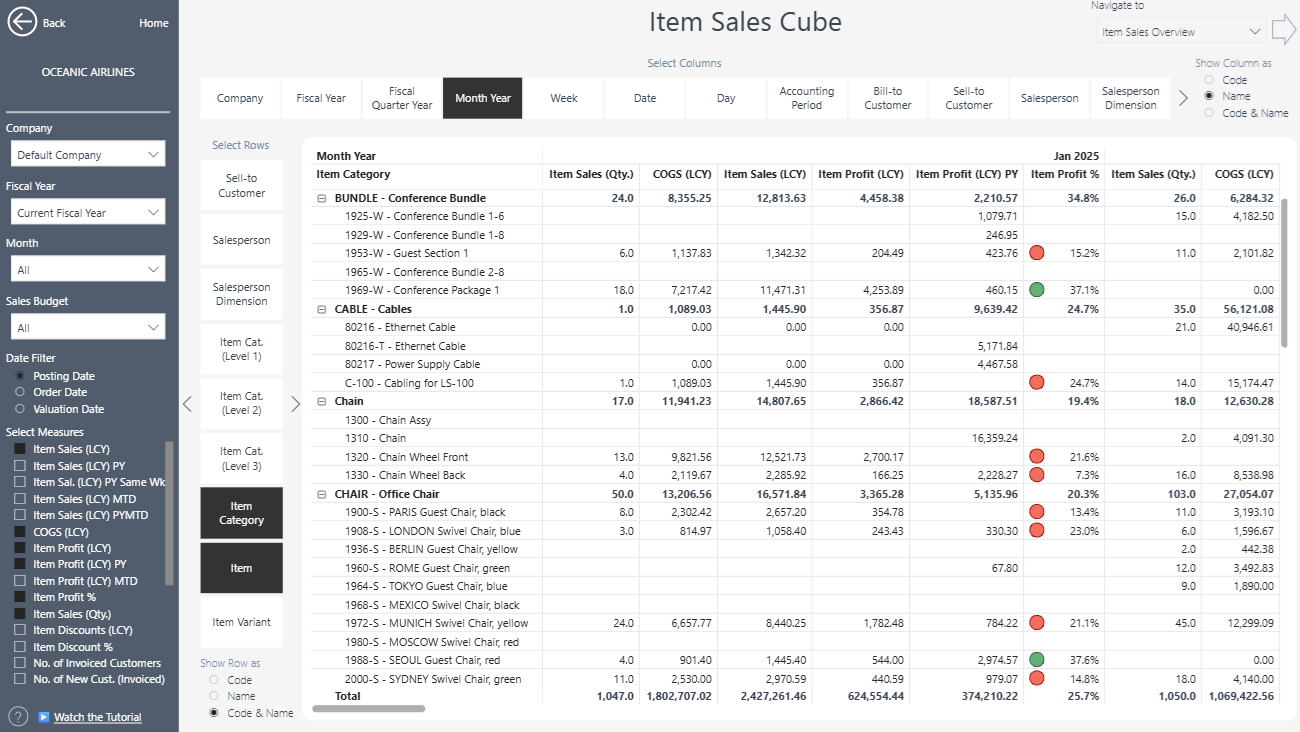
 Cube Reporting
Cube Reports give users complete freedom to create their own ad-hoc reports in just a few clicks, something the standard Microsoft reports simply don’t offer an equivalent for.
You can define your own rows and columns, build hierarchies to drill through data, and select the measures that matter most, such as sales, margins, quantities, or costs. Once configured, your layout can be saved as a bookmark for instant access anytime. Available across all Business Central Insights apps, Cube Reports are often described by users as a pivot table on steroids, the go-to tool for clients who want fast, flexible answers with only a few clicks.