CFO KPIs & Financial Ratios for Business Central

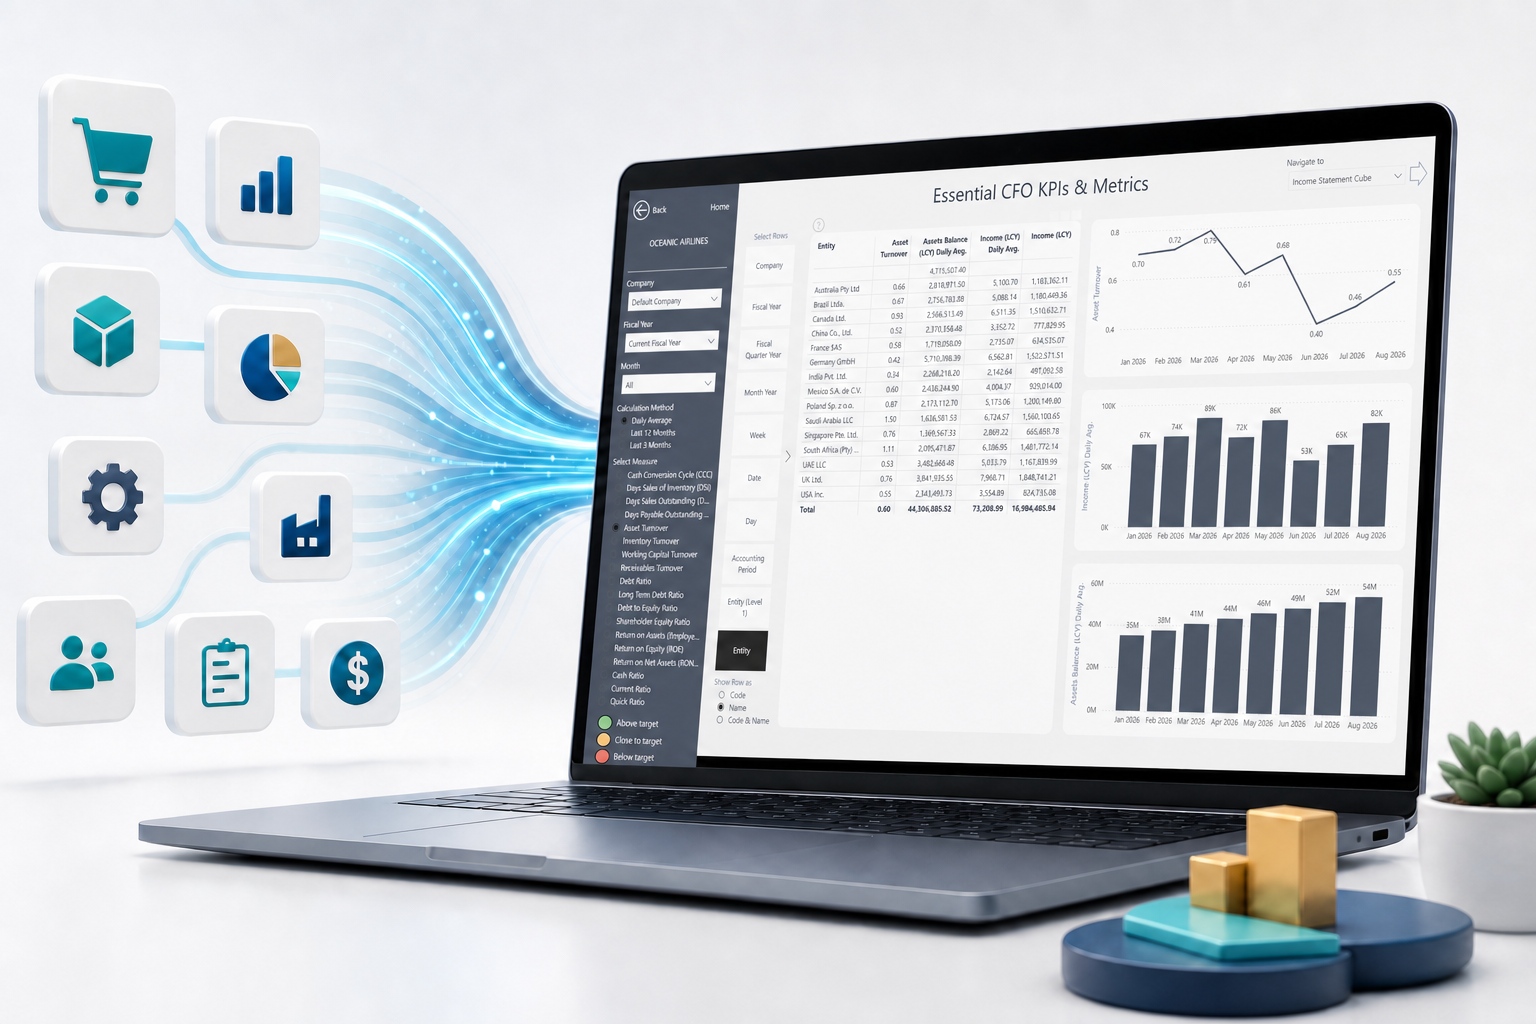
The Essential CFO KPIs & Metrics page in Finance Insights puts 20 financial ratios and KPIs in one place. For whichever ratio you select, the page shows its numerator, its denominator and its trend together, calculated with identical definitions across every company and entity in Business Central. This tutorial explains where the numbers come from, how the Calculation Method and Revenue Basis controls work – including the Closing Balance method that reproduces the figures in Microsoft's standard Finance app – and what each of the 20 ratios means.
Why ratios, and why here?
Business Central already tells you how much you sold, what you spent and what is sitting on the balance sheet. Financial ratios answer the questions those numbers leave open. Six of them keep coming back in every board pack:
The question a finance director keeps asking | Ratio family | Ratios on this page |
|---|---|---|
Is the business converting activity into cash? | Activity (cash conversion) | CCC, DSI, DSO, DPO |
Are the assets working efficiently? | Efficiency | Asset, Inventory, Working Capital and Receivables Turnover |
Is it relying too heavily on debt? | Leverage | Debt, Long Term Debt, Debt to Equity, Shareholder Equity |
Is it generating an adequate return? | Profitability | ROA, ROCE, ROE, RONA |
Can it meet its short-term obligations? | Liquidity | Cash, Current, Quick |
How sensitive is profit to a change in sales? | Operating leverage | Degree of Operating Leverage |
The arithmetic behind these is simple. The hard part is agreeing what belongs in each calculation, applying the same definition across companies and periods, and being able to trace every ratio back to the general ledger entries behind it. A plausible ratio built on inconsistent account classifications is often more dangerous than no ratio at all – which is exactly what this page is designed to prevent.
Four things make the page different from a spreadsheet ratio pack:
Numerator, denominator and ratio on one screen. When DSO jumps from 145 to 235 days, you can see immediately whether receivables rose, revenue fell, or both.
One definition, every company. Select rows by Company or Entity and the same ratio is calculated per entity from the same account categories. A consolidated number can look healthy while one subsidiary carries most of the risk.
Daily-average balances by default. Flow-over-balance ratios use the average balance across every day in the window, not a single closing figure that one large posting near period end can distort.
A closing-balance method when you need one. Switch the Calculation Method to Selected Period (Closing Balance) and the same ratios are calculated the way Microsoft's standard Finance app calculates them, so you can reconcile the two side by side before deciding which basis to report on.
The foundation: G/L Account Categories
Every ratio on this page is built from G/L Account Categories in Business Central. There is no separate mapping table in Power BI and no hard-coded account numbers. When you assign a G/L account to a category such as Assets › Current Assets › Accounts Receivable, Finance Insights knows that account belongs in the receivables balance used by DSO and Receivables Turnover.
Finance Insights reads three levels:
Level | Business Central field | Examples | Used by |
|---|---|---|---|
1 | Account Category (standard BC field) | Assets, Liabilities, Equity, Income, Cost of Goods Sold, Expense | Assets, Liabilities, Equity, Income, COGS totals; Net Profit and EBIT |
2 | Account Subcategory (Power BI) | Current Assets, Non-Current Liabilities, Operating Revenue, Retained Earnings | Current/Quick ratios, Long Term Debt Ratio, Operating Revenue basis |
3 | Account Subcategory 2 (Power BI) | Liquid Assets, Accounts Receivable, Inventory, Prepaid Expenses, Accounts Payable, Fixed Assets, Interest Expense, Tax Expense | Cash Ratio, DSO, DSI, DPO, Quick Ratio, RONA, EBIT |
Do this first. Open G/L Account Categories in Business Central and check the G/L Accounts without Category fact box. If it is not empty, some accounts are outside every ratio. A missing Inventory subcategory, for example, leaves DSI blank and inflates the Quick Ratio, because nothing is being subtracted from current assets.
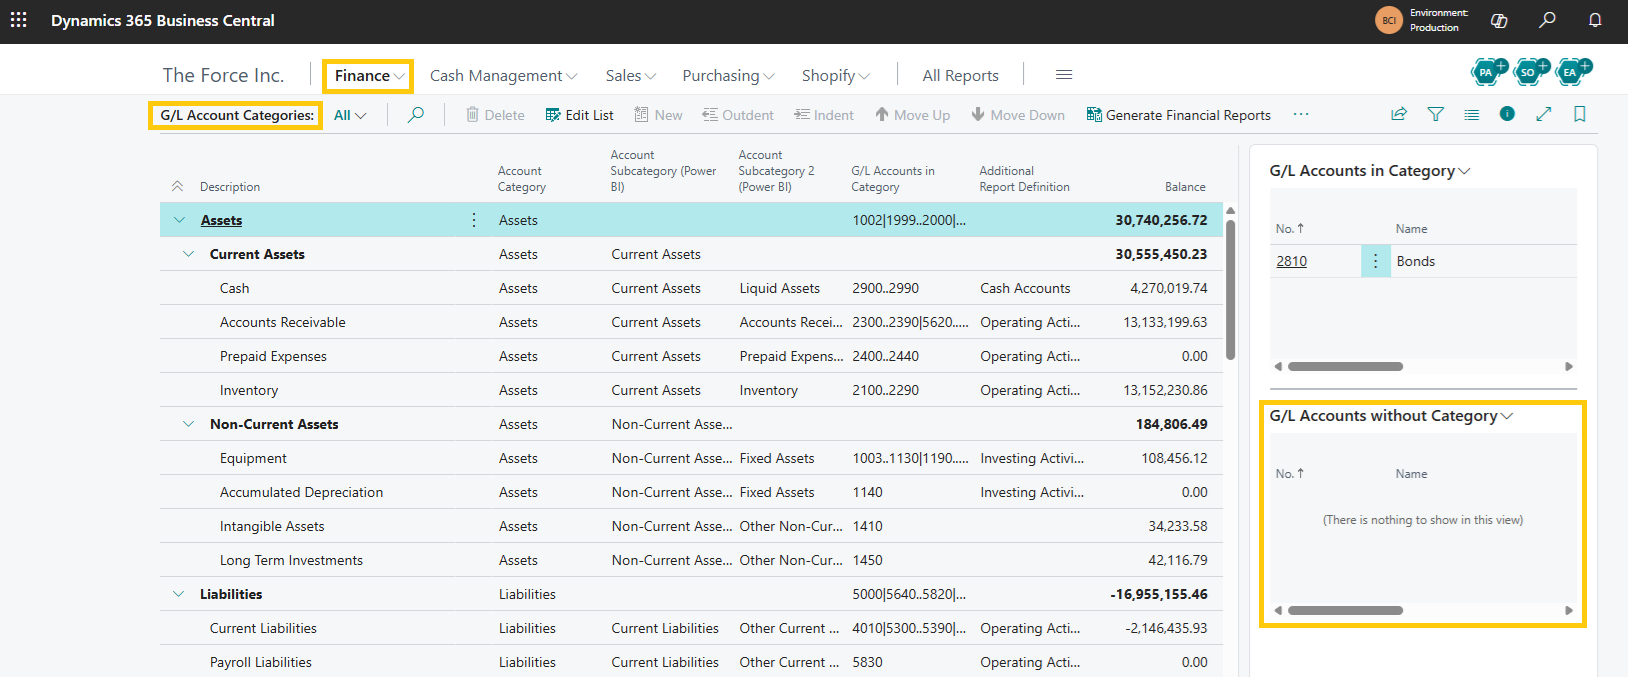
Full setup walkthrough, recommended structure and multi-company rules: How to configure G/L Account Categories.
Multi-company tip. For consolidated ratios, category names, hierarchy and order must be identical in every company. If they are not, the same ratio can silently mean different things in different entities.
Choose a Calculation Method
Ratios that divide a flow (revenue, COGS, profit – measured over a period) by a balance (receivables, inventory, assets – measured at a point in time) need a decision: which balance, and over what window? The Calculation Method control offers four answers:
Method | Balance | Window | Use it when |
|---|---|---|---|
Selected Period (Daily Avg.) | Average of every day in the window | The period you have filtered (e.g. one month) | Reading month-by-month trends – the default |
Last 12 Months (Daily Avg.) | Average of every day in the window | The 12 months ending at the last refreshed date | Comparing to annual benchmarks or bank covenants |
Last 3 Months (Daily Avg.) | Average of every day in the window | The 3 months ending at the last refreshed date | Reacting to recent change without monthly noise |
Selected Period (Closing Balance) | Balance on the last day of the period | The period you have filtered | Reconciling to Microsoft's standard Finance app, or to a spreadsheet that uses period-end balances |
The three Daily Avg. methods: Daily average, not opening/closing average. Each balance is averaged over every calendar day in the window, so a large receipt on the 2nd of the month and one on the 28th are weighted correctly. Spreadsheets typically use the closing balance or the average of opening and closing – simpler, but easily distorted by a single large posting near period end.
Annualization for new customers. The window is clamped to the first G/L entry date. If you went live on Business Central four months ago, a "Last 12 Months" ratio is calculated over the 120 days that exist and then annualised, so turnover and return ratios are not understated. The Ratio Window (Days) measure tells you how many days of data sit behind the figure – check it before comparing to an industry benchmark.
The Closing Balance method
Selected Period (Closing Balance) uses the balance at the end of the selected period, the flow for that period, and the number of calendar days in the period. It is the calculation used by Microsoft's standard Finance app for Business Central, and it is there so that a customer running both apps – or comparing Finance Insights against an existing spreadsheet pack – can get the same number from both before deciding which basis to standardise on.
Three consequences follow from mirroring the standard calculation faithfully:
Turnover and return ratios are not annualised. Asset Turnover, Inventory Turnover, Receivables Turnover, Working Capital Turnover, ROA, ROCE, ROE and RONA are the period's flow divided by the closing balance, full stop. A monthly ROA under this method is therefore roughly one twelfth of the same month's ROA under the Daily Avg. methods. The days-based ratios (DSI, DSO, DPO, CCC) are unaffected because they already scale to the period.
A single posting can move the ratio. A large supplier payment on the last day of the month lowers the closing payables balance and with it DPO, in a way the daily average would barely register. That is not an error – it is the reason the daily average is the default.
Inventory Turnover uses an opening/closing average. The standard app averages the opening and closing inventory balance for this one ratio while using the closing balance for DSI. Finance Insights does the same under this method, so the two apps agree, which means DSI and Inventory Turnover are not exact inverses of each other under Closing Balance the way they are under the Daily Avg. methods.
The balance date under this method respects the page's Balance Last Date setting, so a period that runs past the last refreshed date is capped at the refresh date rather than at the calendar period end. The Ratio Window (Days) measure shows the resulting day count.
Reconciling to the standard Finance app. Set Calculation Method to Selected Period (Closing Balance), Ratio Revenue Basis to Total Income, and select the same company and period in both apps. The remaining differences, if any, come from the G/L Account Category mapping – the standard app reads the same categories, so a discrepancy almost always means an account is categorised differently or not at all.
Which ratios does the Calculation Method affect?
The activity, efficiency and profitability ratios (1–8 and 13–16). The liquidity and leverage ratios (9–12 and 17–19) compare two balances at the same reporting date and always use the closing balance for the selected period, whatever the method. Degree of Operating Leverage (20) compares the selected period with the same period a year earlier and is not affected either.
Choose a Revenue Basis
Five ratios use revenue as an input: DSO, Asset Turnover, Working Capital Turnover, Receivables Turnover and Degree of Operating Leverage. The Ratio Revenue Basis control decides what "revenue" means:
Option | Includes | Choose it when |
|---|---|---|
Total Income (default) | Everything in the Income account category, including interest, rental and other non-operating income | You want to match the convention used by the standard Microsoft Finance app and most external benchmarks |
Operating Revenue | Only accounts under Income › Operating Revenue | You want DSO to reflect trading sales only – e.g. a business with material interest or rental income |
The revenue basis has no effect on ratios that use COGS (DSI, DPO, Inventory Turnover), profit (ROA, ROE, ROCE, RONA) or balances only (liquidity and leverage).
The 20 ratios, explained
Each entry gives the formula as implemented in Finance Insights and the description shown when you hover the ? icon on the page. Where a ratio depends on the Calculation Method, both formulas are shown: the Daily Avg. form applies to the first three methods, the Closing Balance form to the fourth. Ratios are listed in the same order as the Select Measure control.
Activity ratios – how long is cash tied up?
Profit reporting cannot tell you how long it takes to go from paying for inventory to collecting cash from customers. These four measures expose that journey.
1. Cash Conversion Cycle (CCC)
Formula: DSI + DSO − DPO
Cash Conversion Cycle (CCC) is the number of days between paying for inventory and collecting cash from its sale. It adds the days to sell inventory (DSI) and collect receivables (DSO), less the days taken to pay suppliers (DPO). A shorter cycle ties up less cash; a negative cycle means suppliers are effectively financing the business. Uses the Calculation Method and Revenue Basis selected for its three components. Under Selected Period (Closing Balance) all three components use period-end balances and match Microsoft's standard Finance app for Business Central.
In practice: there is no universal target. A grocery business and a capital-equipment manufacturer will run very different cycles. Compare with your own history and budget, and always inspect the three components – a 12-day improvement that comes entirely from stretching suppliers is not the same as one that comes from faster collections.
2. Days Sales of Inventory (DSI)
Formula – Daily Avg.: Inventory Avg. ÷ COGS × days in window Formula – Closing Balance: Inventory ÷ COGS × days in period
Days Sales of Inventory (DSI) is the average number of days inventory is held before it is sold. A rising DSI can indicate overstocking, slow-moving or obsolete items, or weakening demand. Uses cost of goods sold, so a business that expenses inventory on purchase rather than on sale will see a distorted result. Under the Daily Avg. methods it uses daily-average balances over the calculation window (selected period, last 12 months or last 3 months), clamped to the first G/L entry date. Under Selected Period (Closing Balance) it uses the inventory balance at the end of the selected period and that period's COGS, matching Microsoft's standard Finance app for Business Central.
In practice: a company-wide DSI often hides a small number of problem items carrying most of the value. Use Inventory Insights to break the figure down by item category and location.
3. Days Sales Outstanding (DSO)
Formula – Daily Avg.: Accounts Receivable Avg. ÷ Revenue × days in window Formula – Closing Balance: Accounts Receivable ÷ Revenue × days in period
Days Sales Outstanding (DSO) is the average number of days it takes to collect payment after a sale. A rising DSO indicates slower collections or looser credit terms. Revenue is used in place of credit sales because the general ledger does not separate cash sales from credit sales; for a business with significant cash sales, DSO will read lower than the true collection period. Under the Daily Avg. methods it uses daily-average balances over the calculation window (selected period, last 12 months or last 3 months), clamped to the first G/L entry date. Under Selected Period (Closing Balance) it uses the receivables balance at the end of the selected period and that period's revenue, matching Microsoft's standard Finance app for Business Central. Revenue is Income or Operating Revenue depending on the Revenue Basis selection.
Also known as: Average Collection Period.
In practice: read DSO beside overdue value and receivables ageing (Accounts Receivable Insights). One major customer moving from 30 to 90 days may barely move the company average while representing a serious concentration of risk.
4. Days Payable Outstanding (DPO)
Formula – Daily Avg.: Accounts Payable Avg. ÷ COGS × days in window Formula – Closing Balance: Accounts Payable ÷ COGS × days in period
Days Payable Outstanding (DPO) is the average number of days the company takes to pay its suppliers. A higher DPO retains cash longer but may strain supplier relationships or forfeit early-payment discounts. Cost of goods sold is used as a proxy for purchases from suppliers, because the general ledger records what was sold rather than what was bought; the two differ when inventory is building up or running down. Under the Daily Avg. methods it uses daily-average balances over the calculation window (selected period, last 12 months or last 3 months), clamped to the first G/L entry date. Under Selected Period (Closing Balance) it uses the payables balance at the end of the selected period and that period's COGS, matching the calculation in Microsoft's standard Finance app for Business Central; a large payment on the last day of the period will move it in a way the daily average does not.
In practice: a rising DPO shortens the cash conversion cycle mathematically, but it is not automatically good news – it can also mean strained liquidity or suppliers being stretched.
Efficiency ratios – how hard is the balance sheet working?
5. Asset Turnover
Formula – Daily Avg.: Revenue ÷ Assets Avg. × 365 ÷ days in window Formula – Closing Balance: Revenue ÷ Assets
Asset Turnover measures how much revenue is generated per unit of assets. A higher ratio means assets are being used more efficiently; a low ratio can indicate excess capacity or under-utilised assets. Typical values vary widely by industry. Under the Daily Avg. methods it uses daily-average balances over the calculation window (selected period, last 12 months or last 3 months), clamped to the first G/L entry date, and a window shorter than a full year is annualised so a customer new to Business Central is not understated. Under Selected Period (Closing Balance) it is the selected period's revenue divided by the asset balance at the end of the period, not annualised, matching Microsoft's standard Finance app for Business Central; a monthly value is therefore roughly one twelfth of the annualised figure. Revenue is Income or Operating Revenue depending on the Revenue Basis selection.
6. Inventory Turnover
Formula – Daily Avg.: COGS ÷ Inventory Avg. × 365 ÷ days in window Formula – Closing Balance: COGS ÷ ((Opening Inventory + Closing Inventory) ÷ 2)
Inventory Turnover is the number of times inventory is sold and replaced. A higher ratio indicates strong sales or lean stocking; a low ratio indicates slow-moving stock or overstocking. Under the Daily Avg. methods it uses daily-average balances over the calculation window (selected period, last 12 months or last 3 months), clamped to the first G/L entry date, is annualised so a customer new to Business Central is not understated, and is the inverse of DSI expressed in turns rather than days. Under Selected Period (Closing Balance) it is the selected period's COGS divided by the average of the opening and closing inventory balances, not annualised, matching Microsoft's standard Finance app for Business Central; because that app uses an average for this ratio but a closing balance for DSI, the two are not exact inverses under this method.
In practice: under the Daily Avg. methods DSI and Inventory Turnover share the same inputs and window, so they always reconcile: 365 ÷ Inventory Turnover = DSI. If your spreadsheet versions disagree, they are using different periods or averaging methods – and under Closing Balance the small gap between them is expected, for the reason given above.
7. Working Capital Turnover
Formula – Daily Avg.: Revenue ÷ Working Capital Avg. × 365 ÷ days in window Formula – Closing Balance: Revenue ÷ Working Capital
Working Capital Turnover measures how much revenue is generated per unit of working capital (current assets minus current liabilities). A higher ratio means working capital is supporting more sales. The ratio is negative or not meaningful when working capital is negative. Under the Daily Avg. methods it uses daily-average balances over the calculation window (selected period, last 12 months or last 3 months), clamped to the first G/L entry date, and is annualised so a customer new to Business Central is not understated. Under Selected Period (Closing Balance) it is the selected period's revenue divided by working capital at the end of the period, not annualised, matching Microsoft's standard Finance app for Business Central. Revenue is Income or Operating Revenue depending on the Revenue Basis selection.
In practice: a very high result can describe an efficient business or an undercapitalised one. Review it beside the liquidity ratios.
8. Receivables Turnover
Formula – Daily Avg.: Revenue ÷ Accounts Receivable Avg. × 365 ÷ days in window Formula – Closing Balance: Revenue ÷ Accounts Receivable
Receivables Turnover is the number of times receivables are collected. A higher ratio means customers pay faster and credit is well managed; a low ratio indicates slow collections or generous terms. Under the Daily Avg. methods it uses daily-average balances over the calculation window (selected period, last 12 months or last 3 months), clamped to the first G/L entry date, is annualised so a customer new to Business Central is not understated, and is the inverse of DSO expressed in turns rather than days. Under Selected Period (Closing Balance) it is the selected period's revenue divided by the receivables balance at the end of the period, not annualised, matching Microsoft's standard Finance app for Business Central. Revenue is Income or Operating Revenue depending on the Revenue Basis selection.
Leverage ratios – how is the business funded?
These compare balances at the same reporting date, so they are unaffected by the Calculation Method.
9. Debt Ratio
Formula: Liabilities ÷ Assets
Debt Ratio is the proportion of the company's assets financed by liabilities. A ratio above 1 means liabilities exceed assets (negative equity); below 1 means assets exceed liabilities, with the balance funded by equity. Lower values indicate lower financial risk.
In practice: Finance Insights uses total liabilities. Some organisations define debt as interest-bearing borrowings only. Both are valid, but they are not interchangeable – label the convention in any management pack.
10. Long Term Debt Ratio
Formula: Non-Current Liabilities ÷ Assets
Long Term Debt Ratio is the proportion of the company's assets financed by long-term (non-current) liabilities. Non-current liabilities include long-term borrowings, lease liabilities, deferred tax, provisions and pension obligations, so the ratio is broader than a borrowings-only measure. It shows how much of the asset base would need to be liquidated to settle those obligations.
11. Debt to Equity Ratio
Formula: Liabilities ÷ Equity
Debt to Equity (D/E) compares total liabilities to shareholders' equity and shows how much of the business is financed by creditors versus owners. Higher values mean higher leverage and greater risk to shareholders. Not meaningful when equity is negative.
In practice: loan covenants often prescribe their own definition, usually based on interest-bearing debt only. Reconcile the Finance Insights figure to the lender's calculation rather than assuming they match.
12. Shareholder Equity Ratio
Formula: Equity ÷ Assets
Shareholder Equity Ratio is the proportion of the company's assets financed by shareholders' equity rather than liabilities. The closer to 1, the less the company relies on debt. It is the complement of the Debt Ratio; the two sum to 1.
Profitability ratios – what return is the business generating?
Profit in currency answers "how much?" Return ratios answer "relative to what?" – which is usually the question a board, shareholder or lender actually needs answered. Under the Daily Avg. methods all four are annualised; under Selected Period (Closing Balance) they are period figures, as in the standard Finance app.
13. Return on Assets (ROA)
Formula – Daily Avg.: Net Profit ÷ Assets Avg. × 365 ÷ days in window Formula – Closing Balance: Net Profit ÷ Assets
Return on Assets (ROA) is Net Profit as a percentage of total assets. It shows how efficiently the asset base is used to generate profit, regardless of how the assets are financed. Under the Daily Avg. methods it uses daily-average balances over the calculation window (selected period, last 12 months or last 3 months), clamped to the first G/L entry date, and is annualised so a customer new to Business Central is not understated. Under Selected Period (Closing Balance) it is the selected period's Net Profit divided by the asset balance at the end of the period, not annualised, matching Microsoft's standard Finance app for Business Central; a monthly value is therefore roughly one twelfth of the annualised figure.
14. Return on Capital Employed (ROCE)
Formula – Daily Avg.: EBIT ÷ Capital Employed Avg. × 365 ÷ days in window Formula – Closing Balance: EBIT ÷ Capital Employed
Return on Capital Employed (ROCE) is EBIT as a percentage of capital employed (total assets less current liabilities). It shows how much operating profit is generated from the long-term capital invested in the business, before financing costs and tax. Under the Daily Avg. methods it uses daily-average balances over the calculation window (selected period, last 12 months or last 3 months), clamped to the first G/L entry date, and is annualised so a customer new to Business Central is not understated. Under Selected Period (Closing Balance) it is the selected period's EBIT divided by capital employed at the end of the period, not annualised, matching Microsoft's standard Finance app for Business Central.
In practice: because ROCE uses profit before interest and tax, it strips out financing and tax structures and gives a fairer operating comparison between entities.
15. Return on Equity (ROE)
Formula – Daily Avg.: Net Profit ÷ Equity Avg. × 365 ÷ days in window Formula – Closing Balance: Net Profit ÷ Equity
Return on Equity (ROE) is Net Profit as a percentage of shareholders' equity. It shows the return generated on the owners' investment. ROE rises with leverage, so it should be read alongside the Debt to Equity Ratio. Not meaningful when equity is negative. Under the Daily Avg. methods it uses daily-average balances over the calculation window (selected period, last 12 months or last 3 months), clamped to the first G/L entry date, and is annualised so a customer new to Business Central is not understated. Under Selected Period (Closing Balance) it is the selected period's Net Profit divided by equity at the end of the period, not annualised, matching Microsoft's standard Finance app for Business Central.
16. Return on Net Assets (RONA)
Formula – Daily Avg.: Net Profit ÷ (Fixed Assets Avg. + Working Capital Avg.) × 365 ÷ days in window Formula – Closing Balance: Net Profit ÷ (Fixed Assets + Working Capital)
Return on Net Assets (RONA) is Net Profit as a percentage of net assets, defined as fixed assets plus working capital (current assets less current liabilities). It shows how well the operating asset base is used to generate profit. Under the Daily Avg. methods it uses daily-average balances over the calculation window (selected period, last 12 months or last 3 months), clamped to the first G/L entry date, and is annualised so a customer new to Business Central is not understated. Under Selected Period (Closing Balance) it is the selected period's Net Profit divided by net assets at the end of the period, not annualised, matching Microsoft's standard Finance app for Business Central.
In practice: particularly useful for asset-intensive businesses. Whether intangibles or leases land in Fixed Assets depends on your G/L Account Category mapping – document it.
Liquidity ratios – can the business pay what is due?
These progressively narrow which current assets count as available to meet short-term obligations. They compare closing balances at the reporting date and are unaffected by the Calculation Method.
17. Cash Ratio
Formula: Liquid Assets ÷ Current Liabilities
Cash Ratio measures the ability to meet short-term obligations using only cash and cash equivalents. It is the most conservative liquidity ratio; a value above 1 means current liabilities could be paid from cash alone, though very high values may indicate idle cash.
18. Current Ratio
Formula: Current Assets ÷ Current Liabilities
Current Ratio measures the ability to meet obligations due within one year using assets expected to convert to cash within one year. A value above 1 means current assets exceed current liabilities; values well above 2 may indicate under-used assets.
In practice: its weakness is treating cash, slow-moving inventory and prepayments as though they were equally liquid – which is why the Quick Ratio exists.
19. Quick Ratio
Formula: (Current Assets − Inventory − Prepaid Expenses) ÷ Current Liabilities
Quick Ratio (acid-test ratio) measures the ability to meet short-term obligations using only assets that can be converted to cash quickly. It excludes inventory and prepaid expenses from current assets. A value above 1 means the company can cover current liabilities without selling inventory.
In practice: the gap between the Current and Quick ratios is itself informative – a wide gap shows how heavily short-term liquidity depends on selling inventory.
Operating leverage – how sensitive is profit to sales?
20. Degree of Operating Leverage (DOL)
Formula: EBIT YOY % ÷ Revenue YOY %
Degree of Operating Leverage (DOL) is the percentage change in EBIT for each 1% change in revenue, comparing the selected period with the same period a year earlier. A DOL of 2 means a 1% rise in revenue lifts EBIT by 2%; the higher the ratio, the larger the share of fixed costs and the more sensitive profit is to changes in sales. Not affected by the Calculation Method. Shown as blank when revenue moved by less than 1% or when prior-year EBIT was zero or negative, since the result would not be meaningful. Most stable on Fiscal Year or Fiscal Quarter rows; monthly values can swing widely. Revenue is Income or Operating Revenue depending on the Revenue Basis selection.
In practice: a high DOL cuts both ways. It amplifies profit growth when sales rise and profit decline when sales fall, so a business with a DOL of 3 and a soft outlook should be planning its fixed-cost base now. Read it beside the trend in EBIT and revenue shown in the page's two component charts, and compare like-for-like periods (the prior-year comparison is clamped to the same portion of the year, so a year-to-date figure compares against the same year-to-date last year).
Ratio Window (Days)
Shown in the table beside the ratio, this is the number of days of data behind the figure for the selected Calculation Method. Under the Daily Avg. methods it is 365 (or about 92 for Last 3 Months) for a customer with a full history, and fewer for a customer newly live on Business Central or a period selection that starts before the first posting; ratios over a short window are annualised, so check this figure before comparing them to industry benchmarks. Under Selected Period (Closing Balance) it is simply the number of calendar days in the selected period, capped at the balance date, and is used by DPO, DSO and DSI only.
Quick reference
# | Ratio | Formula – Daily Avg. methods | Formula – Closing Balance | Type | Calc. Method | Revenue Basis |
|---|---|---|---|---|---|---|
1 | Cash Conversion Cycle | DSI + DSO − DPO | DSI + DSO − DPO | Days | ✅ | ✅ |
2 | Days Sales of Inventory | Inventory Avg. ÷ COGS × days | Inventory ÷ COGS × days | Days | ✅ | |
3 | Days Sales Outstanding | AR Avg. ÷ Revenue × days | AR ÷ Revenue × days | Days | ✅ | ✅ |
4 | Days Payable Outstanding | AP Avg. ÷ COGS × days | AP ÷ COGS × days | Days | ✅ | |
5 | Asset Turnover | Revenue ÷ Assets Avg. (annualised) | Revenue ÷ Assets | Ratio | ✅ | ✅ |
6 | Inventory Turnover | COGS ÷ Inventory Avg. (annualised) | COGS ÷ avg. of opening & closing Inventory | Ratio | ✅ | |
7 | Working Capital Turnover | Revenue ÷ Working Capital Avg. (annualised) | Revenue ÷ Working Capital | Ratio | ✅ | ✅ |
8 | Receivables Turnover | Revenue ÷ AR Avg. (annualised) | Revenue ÷ AR | Ratio | ✅ | ✅ |
9 | Debt Ratio | Liabilities ÷ Assets | same | Ratio | ||
10 | Long Term Debt Ratio | Non-Current Liabilities ÷ Assets | same | Ratio | ||
11 | Debt to Equity Ratio | Liabilities ÷ Equity | same | Ratio | ||
12 | Shareholder Equity Ratio | Equity ÷ Assets | same | Ratio | ||
13 | Return on Assets | Net Profit ÷ Assets Avg. (annualised) | Net Profit ÷ Assets | % | ✅ | |
14 | Return on Capital Employed | EBIT ÷ Capital Employed Avg. (annualised) | EBIT ÷ Capital Employed | % | ✅ | |
15 | Return on Equity | Net Profit ÷ Equity Avg. (annualised) | Net Profit ÷ Equity | % | ✅ | |
16 | Return on Net Assets | Net Profit ÷ (Fixed Assets + Working Capital) Avg. (annualised) | Net Profit ÷ (Fixed Assets + Working Capital) | % | ✅ | |
17 | Cash Ratio | Liquid Assets ÷ Current Liabilities | same | Ratio | ||
18 | Current Ratio | Current Assets ÷ Current Liabilities | same | Ratio | ||
19 | Quick Ratio | (Current Assets − Inventory − Prepaid Expenses) ÷ Current Liabilities | same | Ratio | ||
20 | Degree of Operating Leverage | EBIT YOY % ÷ Revenue YOY % | same | Ratio | ✅ |
Avg. = daily average over the calculation window · days = days in the calculation window (Daily Avg.) or calendar days in the selected period (Closing Balance) · Annualised = × 365 ÷ days in window · Closing Balance = balance on the last day of the selected period, flow for the selected period, not annualised · YOY % = change versus the same period a year earlier, as a percentage of the prior-year value.
Building blocks: Working Capital = Current Assets − Current Liabilities · Capital Employed = Assets − Current Liabilities · Net Profit = Income − COGS − Expenses · EBIT = Net Profit before Interest Expense and Tax Expense · Revenue = Total Income or Operating Revenue per the Revenue Basis selection.
Making the ratio set useful in your organisation
Agree a definition and an owner for each ratio. Ratios that share a name but not a formula are worse than no ratios.
Fix the calculation basis and note it in the board pack – e.g. "Daily average, last 12 months, total income basis". If you moved from the standard Finance app or a spreadsheet, run one month on Selected Period (Closing Balance) first to confirm the figures reconcile, then switch to the daily-average basis for ongoing reporting and record the date you did so.
Show context. Trend, target and budget beat a standalone number every time.
Keep the components visible. If DSO rises, the reader needs to see whether receivables grew, sales fell or both. This page does that by design.
Preserve the route to the entries. Use Navigate to and drill-through to get from a ratio to the company, account, customer, supplier or item that caused the movement.
Define the action. Decide what happens when a ratio crosses a threshold, and who is responsible.
Use the 20 ratios as a checklist against your current reporting. For each one, record whether it is calculated today, whether its definition and averaging basis are documented, whether it can be compared consistently between entities, and whether users can reach the Business Central entries behind it.
Next steps
How to configure G/L Account Categories – the setup every ratio depends on
Financial Reporting tutorial – Income Statement, Balance Sheet and Cash Flow Statement in Finance Insights
Finance Insights – all pages in the app
Standard vs Insights – how these ratios compare with Microsoft's standard Finance app (https://businesscentralinsights.com/standard-vs-insights-comparison)
Book a demo to see the ratio pages on your own data