Days of Inventory in Business Central

What the Days of Inventory report tells you
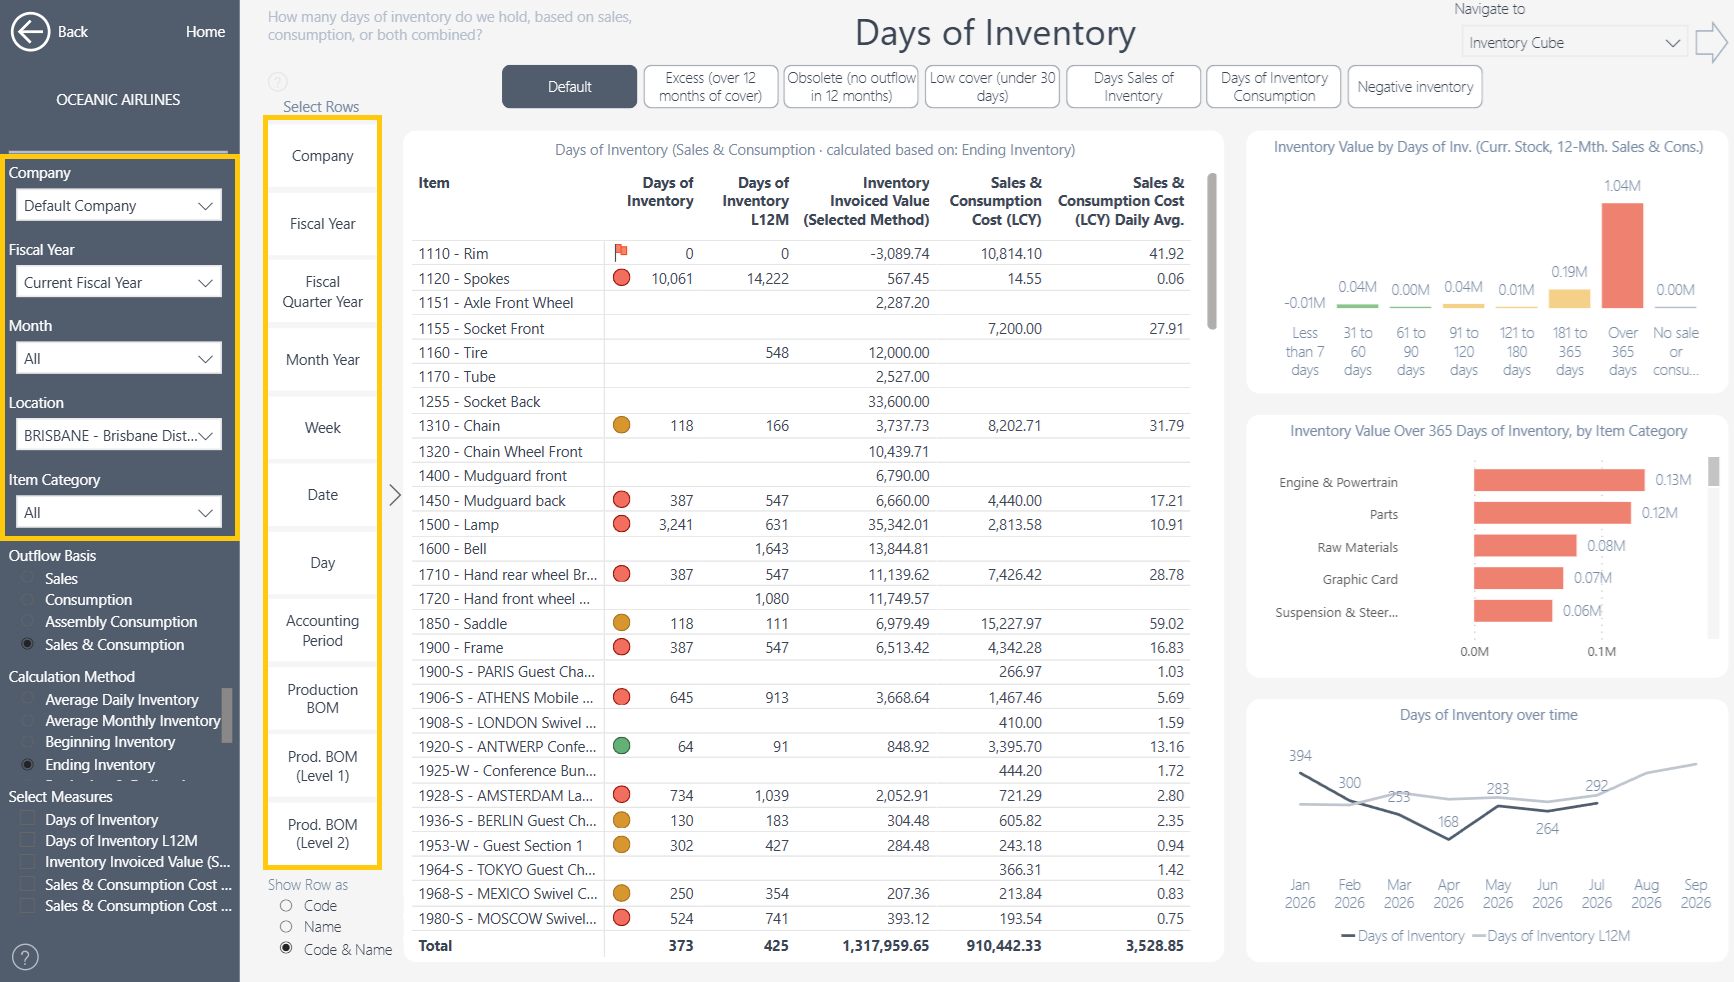
The Days of Inventory report answers one question: if we stopped buying and producing today, how many days would our current stock last?
For every item, it takes the value of the inventory you hold and divides it by how much of that item leaves inventory on an average day. An item with 30 days of inventory has roughly a month of stock on hand. An item with 800 days has more than two years' worth – money sitting on the shelf. An item with 5 days is close to running out.
The report is part of the Inventory Insights app for Microsoft Dynamics 365 Business Central and is calculated straight from your Business Central value entries, so the figures reconcile to your inventory valuation. You can view it by company, fiscal year, month, location and item category using the slicers on the left, and switch the rows between Item, Item Category, Location, Date and other groupings using the Select Rows panel.
 Use it to:
Spot excess stock that ties up cash (very high days of inventory)
Find items that no longer move at all (obsolete stock)
Catch items that are about to run out (low cover)
Track whether your overall stock position is improving or worsening month by month
The two most important controls are in the left menu: Outflow Basis (what counts as stock leaving) and Calculation Method (which inventory balance is used). The sections below explain them, then walk through each tab at the top of the page and the columns in the table.
Outflow Basis – what counts as stock leaving
Outflow Basis decides which movements are treated as demand when the report works out how fast an item is used up. Only stock that leaves inventory because a customer bought it or production used it counts. Transfers between locations and negative adjustments are not demand, so they are never included.
Option | What is counted as outflow | Best for |
|---|---|---|
Sales | Cost of goods sold – the actual cost of items invoiced to customers, including item charges applied to sales | Trading companies and finished goods that are only sold |
Consumption | Cost of components consumed by production orders | Raw materials and components used only in manufacturing |
Assembly Consumption | Cost of components consumed by assembly orders | Components used only in assembly |
Sales & Consumption (default) | All three of the above added together | Companies that both sell and produce, and items that are sold and used in production |
Sales & Consumption is the default because it gives the complete picture. A tyre that is sold as a spare part and also fitted to bicycles in production has two demand streams; measuring only one of them would overstate how long the stock lasts.
The table title changes to show your choice – for example Days of Inventory (Sales · calculated based on: Ending Inventory) – and the cost columns on the right of the table switch to match: COGS (LCY) for Sales, Consumption Cost (LCY) for Consumption, and Sales & Consumption Cost (LCY) for the combined basis.
A blank Days of Inventory value means the item had no outflow of the selected basis in the period. Try another basis, or look at the L12M column, before concluding the item is obsolete.
Note: the two summary charts on the right (Inventory Value by Days of Inventory and Inventory Value Over 365 Days of Inventory by Item Category) always use current stock and 12 months of Sales & Consumption, whatever basis you select.
Calculation Method – which inventory balance is used
Inventory levels change every day, so the report has to decide which inventory value to divide by. The Calculation Method selector controls this. It affects the inventory side of the ratio only; the outflow side is unchanged.
Option | Inventory value used | When to use it |
|---|---|---|
Average Daily Inventory | The average of the inventory balance on each day of the selected period | The most accurate view for a whole period; smooths out day-to-day swings. This is the default in the underlying measures |
Average Monthly Inventory | The average of the month-end balances in the selected period | Comparable to month-end reporting; useful when looking at a full fiscal year |
Beginning Inventory | The balance at the start of the selected period | Answers "how long would the stock we started the period with have lasted?" |
Ending Inventory | The balance at the end of the selected period (today's stock when the current period is selected) | The most common choice for "where are we now" – it shows how long today's stock will last |
Beginning & Ending Avg. | The average of the opening and closing balances of the selected period | A simple, widely used approximation of average inventory when daily balances are not needed |
Minimum Inventory | The lowest daily balance in the selected period | Shows the worst-case cover – how long the stock would have lasted at its lowest point |
Maximum Inventory | The highest daily balance in the selected period | Shows the peak stock position – useful for spotting over-ordering within the period |
The selected method appears in the table title, e.g. calculated based on: Ending Inventory, and drives the Inventory Invoiced Value (Selected Method) column so you can always see the exact inventory value behind each ratio.
Inventory is always valued at actual (invoiced) cost, exactly as in the Business Central inventory valuation. Quantity-based versions of the ratios use the physical item ledger quantity instead.
The report tabs
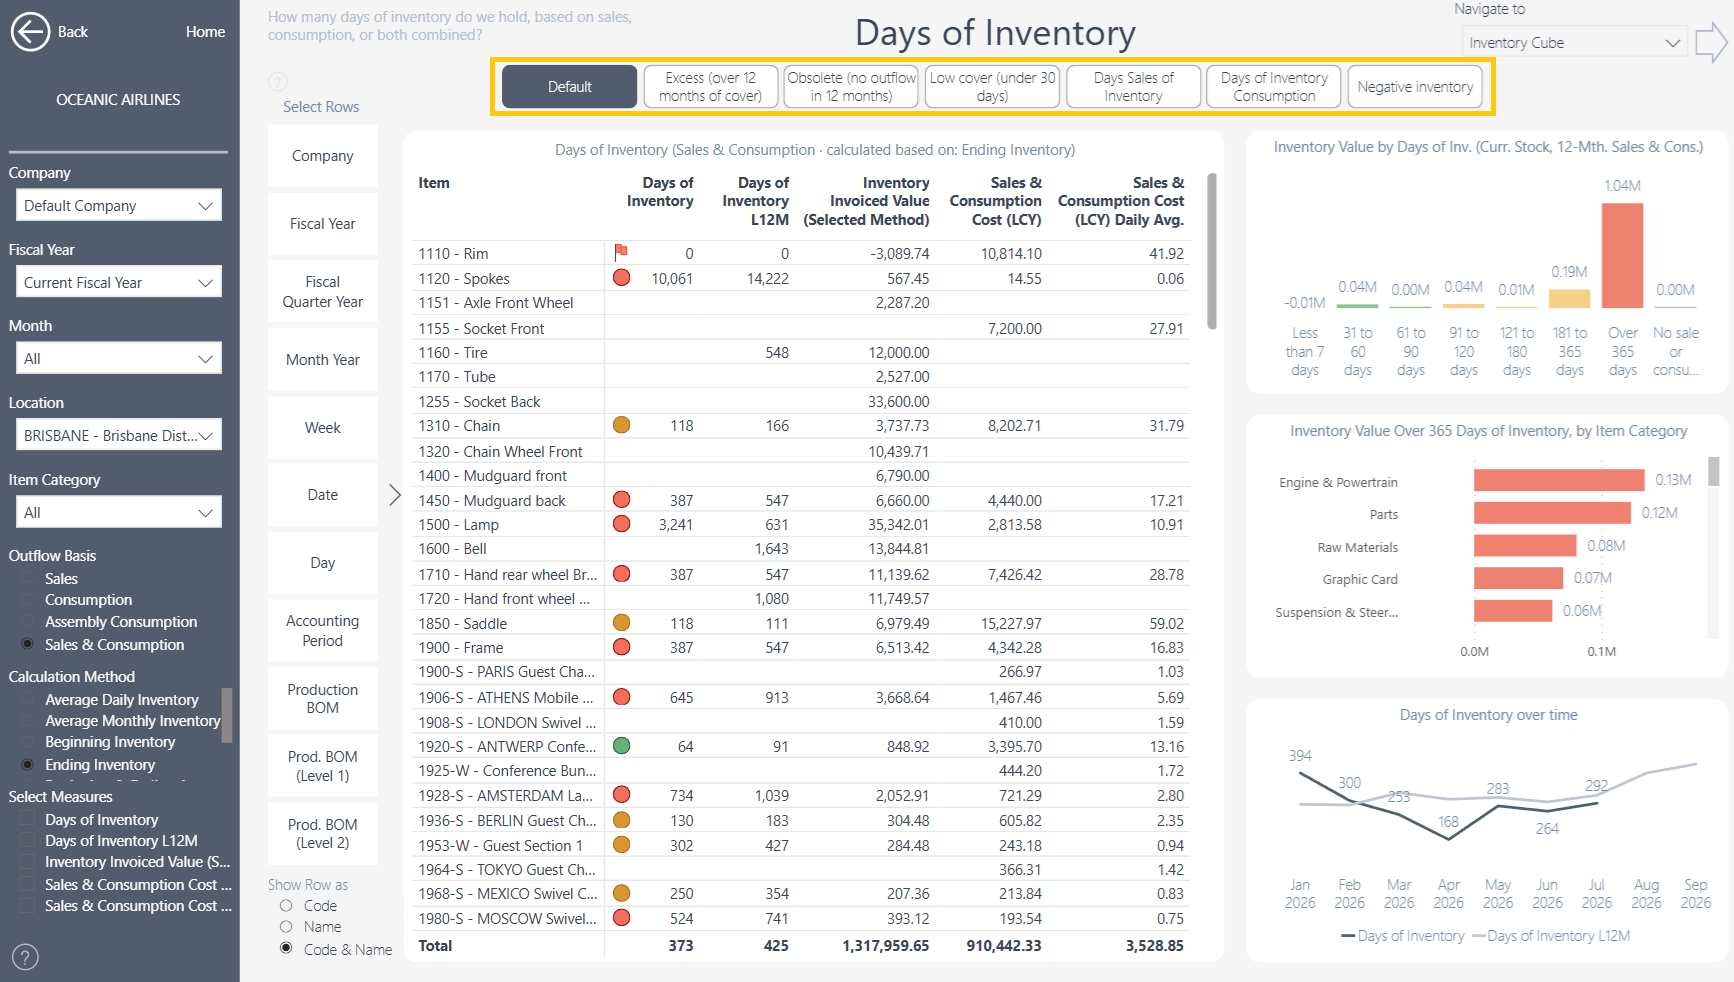 The row of buttons above the table works like a set of saved views. Each one applies a ready-made filter or basis so that you can answer a common question with one click. The charts on the right update to match.
Default
All items with stock or outflow in the selected period, on the basis and method you have chosen in the left menu (Sales & Consumption and Ending Inventory unless you change them). Start here for the full picture.
Excess (over 12 months of cover)
Only items whose Days of Inventory is above 365 – you hold more than a year of stock at the current rate of use. This is where cash is tied up. Sort by Inventory Invoiced Value to see which items matter most; the Inventory Value Over 365 Days of Inventory, by Item Category chart shows where the excess is concentrated.
Obsolete (no outflow in 12 months)
Items that still carry inventory value but have had no sales or consumption of the selected basis in the last 12 months. The Days of Inventory columns are blank because there is nothing to divide by. These items are candidates for write-down, promotion or disposal. Some rows show an L12M cost but no current-period outflow; these have stopped moving recently.
Low cover (under 30 days)
Items with fewer than 30 days of stock at the current rate of use – the ones most at risk of a stock-out. Green means comfortably above the lower threshold, amber is approaching it, and a red flag marks items whose Days of Inventory is zero because the inventory balance is zero or negative.
Days Sales of Inventory
Switches the Outflow Basis to Sales only. Days of Inventory then equals the classic Days Sales of Inventory (DSI) ratio, and the cost columns become COGS (LCY) and COGS (LCY) Daily Avg. Use this tab when you want the pure trading view, ignoring production.
Days of Inventory Consumption
Switches the Outflow Basis to Consumption only – how long the stock lasts against production usage. Items that are only sold, never consumed, show a blank ratio here. The cost columns become Consumption Cost (LCY) and Consumption Cost (LCY) Daily Avg.
Negative inventory
Items whose inventory balance is negative, usually because sales or consumption were posted before the receipt. Days of Inventory shows 0 with a red flag. These need to be corrected in Business Central; until then the ratios for these items are not meaningful.
The tabs are shortcuts, not separate reports. After clicking one you can still change the Outflow Basis, Calculation Method, slicers and rows – and click Default to clear the tab filter.
The charts on the right
Inventory Value by Days of Inventory – your total inventory value split into cover bands (less than 7 days, 8 to 30, 31 to 60 … over 365 days, and no sale or consumption). A large bar on the right means most of your money is in slow stock. Click a bar to filter the table to that band.
Inventory Value Over 365 Days of Inventory, by Item Category – where the excess stock sits by category.
Days of Inventory over time – the monthly trend of Days of Inventory (dark line) against the rolling 12-month figure (light line). If the dark line is above the light line, stock is currently turning more slowly than its yearly average.
Related reports: Days Sales of Inventory and Inventory Turnover
Days of Inventory is one of three related pages in the Inventory Ratios area. They share the same table layout, the same slicers, the same Calculation Method selector, the same colour thresholds and the same summary charts, so once you know one you know all three.
Days Sales of Inventory
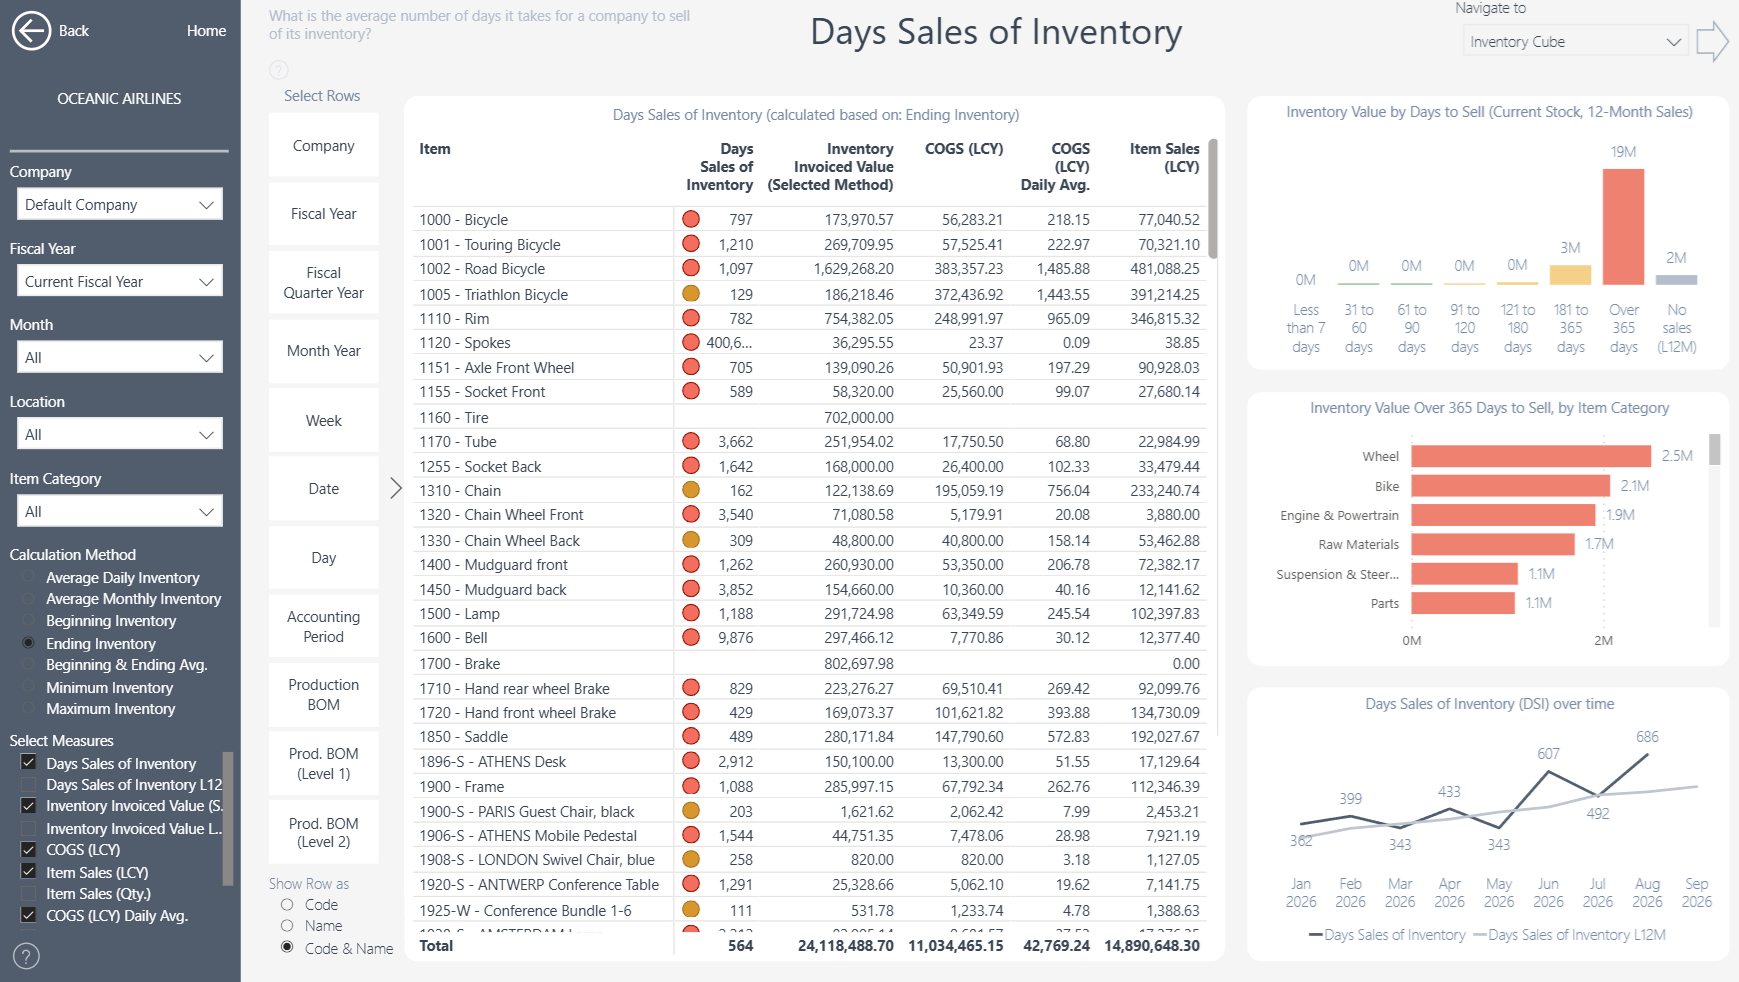 Days Sales of Inventory (DSI) is the classic finance ratio: the average number of days it takes to sell the inventory, based on cost of goods sold only. It is the same calculation as Days of Inventory with the Outflow Basis fixed to Sales, so there is no Outflow Basis selector on this page. It offers all seven calculation methods, including Beginning & Ending Avg., Minimum Inventory and Maximum Inventory, and adds Item Sales (LCY) and Item Sales (Qty.) columns. Use it when you want a figure that matches the textbook DSI definition or that a finance team can compare with external benchmarks.
Inventory Turnover
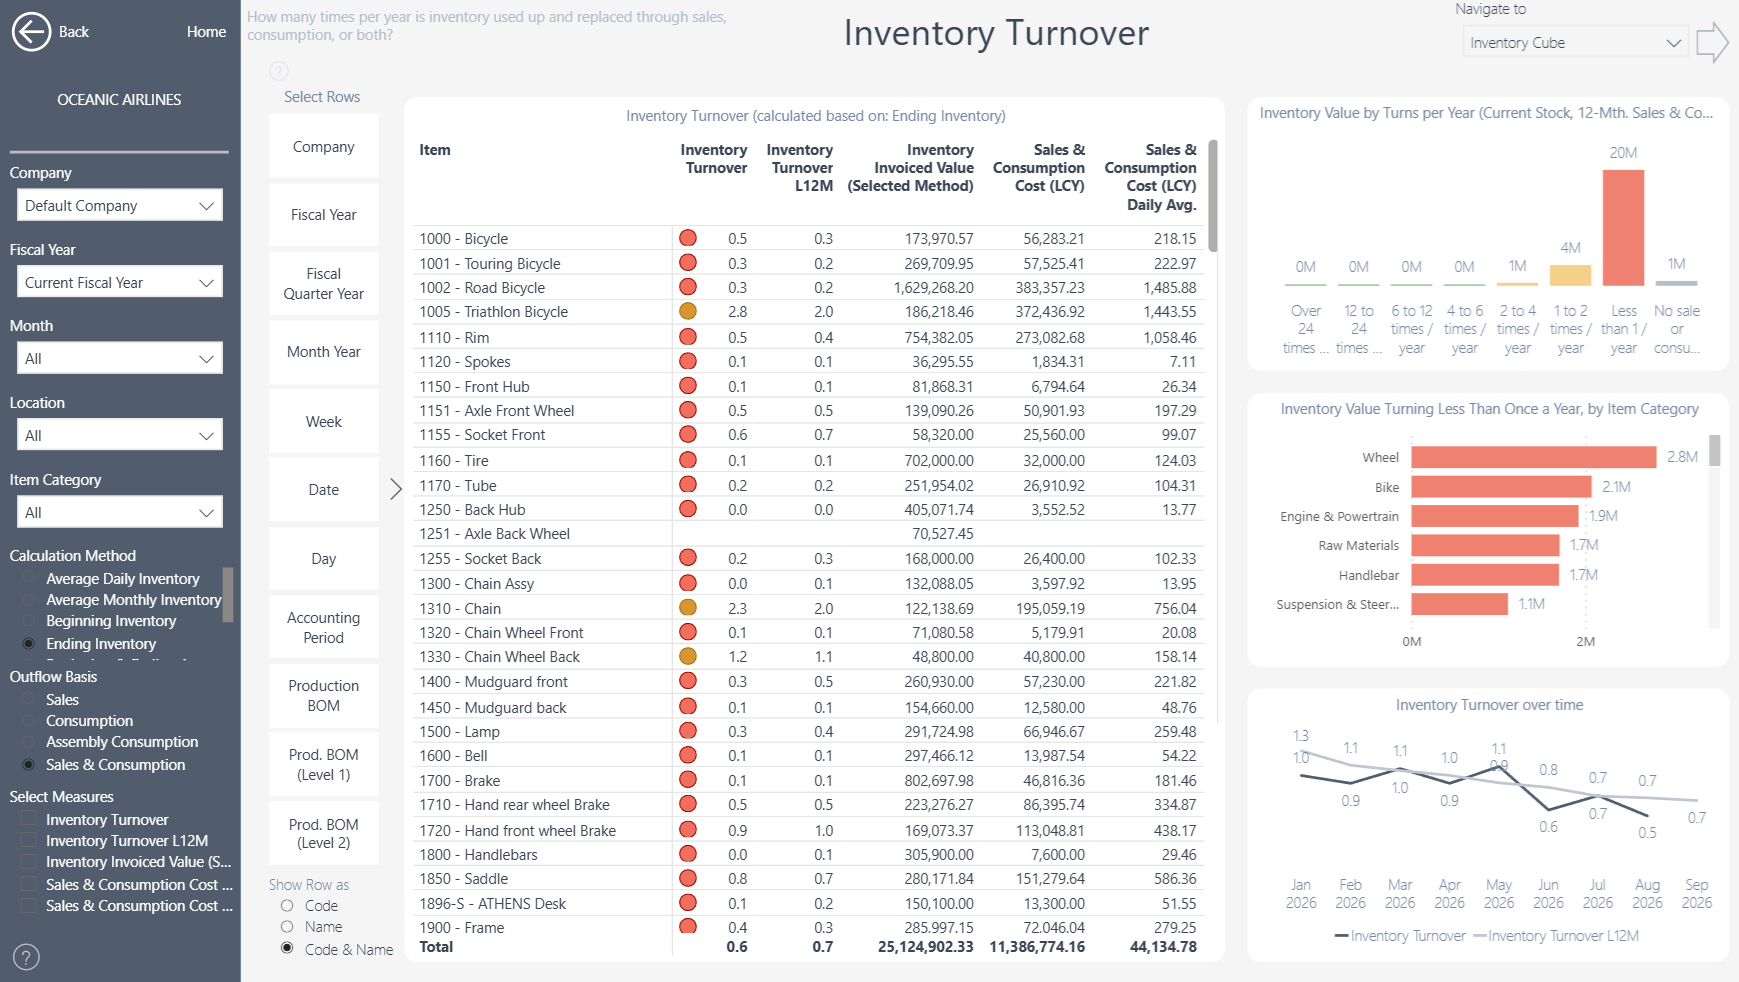 Inventory Turnover looks at the same relationship from the other side: instead of asking how many days the stock lasts, it asks how many times per year the inventory is used up and replaced. It is annualised from the selected period – average daily outflow cost multiplied by 365, divided by the inventory value – so a turnover of 2.0 means the stock turns twice a year, which is the same as about 180 days of inventory. A low turnover points to weak demand or excess stock; a high turnover points to strong demand or possibly too little stock.
The Inventory Turnover page works exactly like Days of Inventory: the same Outflow Basis options (Sales, Consumption, Assembly Consumption, Sales & Consumption), the same Calculation Method options, an Inventory Turnover L12M column for the rolling 12-month rate, quantity-based versions of the measures, and the same charts – with the bands expressed as turns per year (over 24 times, 12 to 24, 6 to 12 … less than once a year, no sale or consumption). With the Sales basis it equals the separate Inventory Turnover (Sales) measure, the companion of Days Sales of Inventory.
In short:
Report | Question it answers | Outflow Basis |
|---|---|---|
Days of Inventory | How many days will the stock last? | Selectable |
Days Sales of Inventory | How many days will the stock last against sales only? | Sales |
Inventory Turnover | How many times a year does the stock turn over? | Selectable |
As always, please share your feedback with us. We are continually improving our apps and will do our best to include your suggestions in future releases.