Item Availability & Supply Planning in Business Central

What Item Availability shows
Item Availability answers one question for every item you stock: will there be enough on the date it is needed? It starts from the stock you have now, adds every open supply document and subtracts every open demand document, and shows the resulting balance day by day, week by week or month by month – the same logic as Business Central's Item Availability by Event and by Periods pages, but for all items at once, across companies and locations, with values and planning advice on top.
Use it to:
see which items run short and when, before the shortage happens
see what is already on order (purchase, production, assembly, transfer) and when it lands
add a demand forecast, sales budget or your own sales history on top of open orders
get a suggested order quantity and an order-by date for every item at risk
value stock, receipts, demand and the projected balance on one consistent cost basis
All figures are read from Business Central at the last refresh. The refresh date is shown on every page; every projection starts from that date.
The pages and tabs
Item Availability is a set of pages reached from the Item Availability column on the home page. The main page, Item Availability Table, has a tab bar at the top; each tab is a ready-made column set on the same table, so the filters on the left apply to all of them.
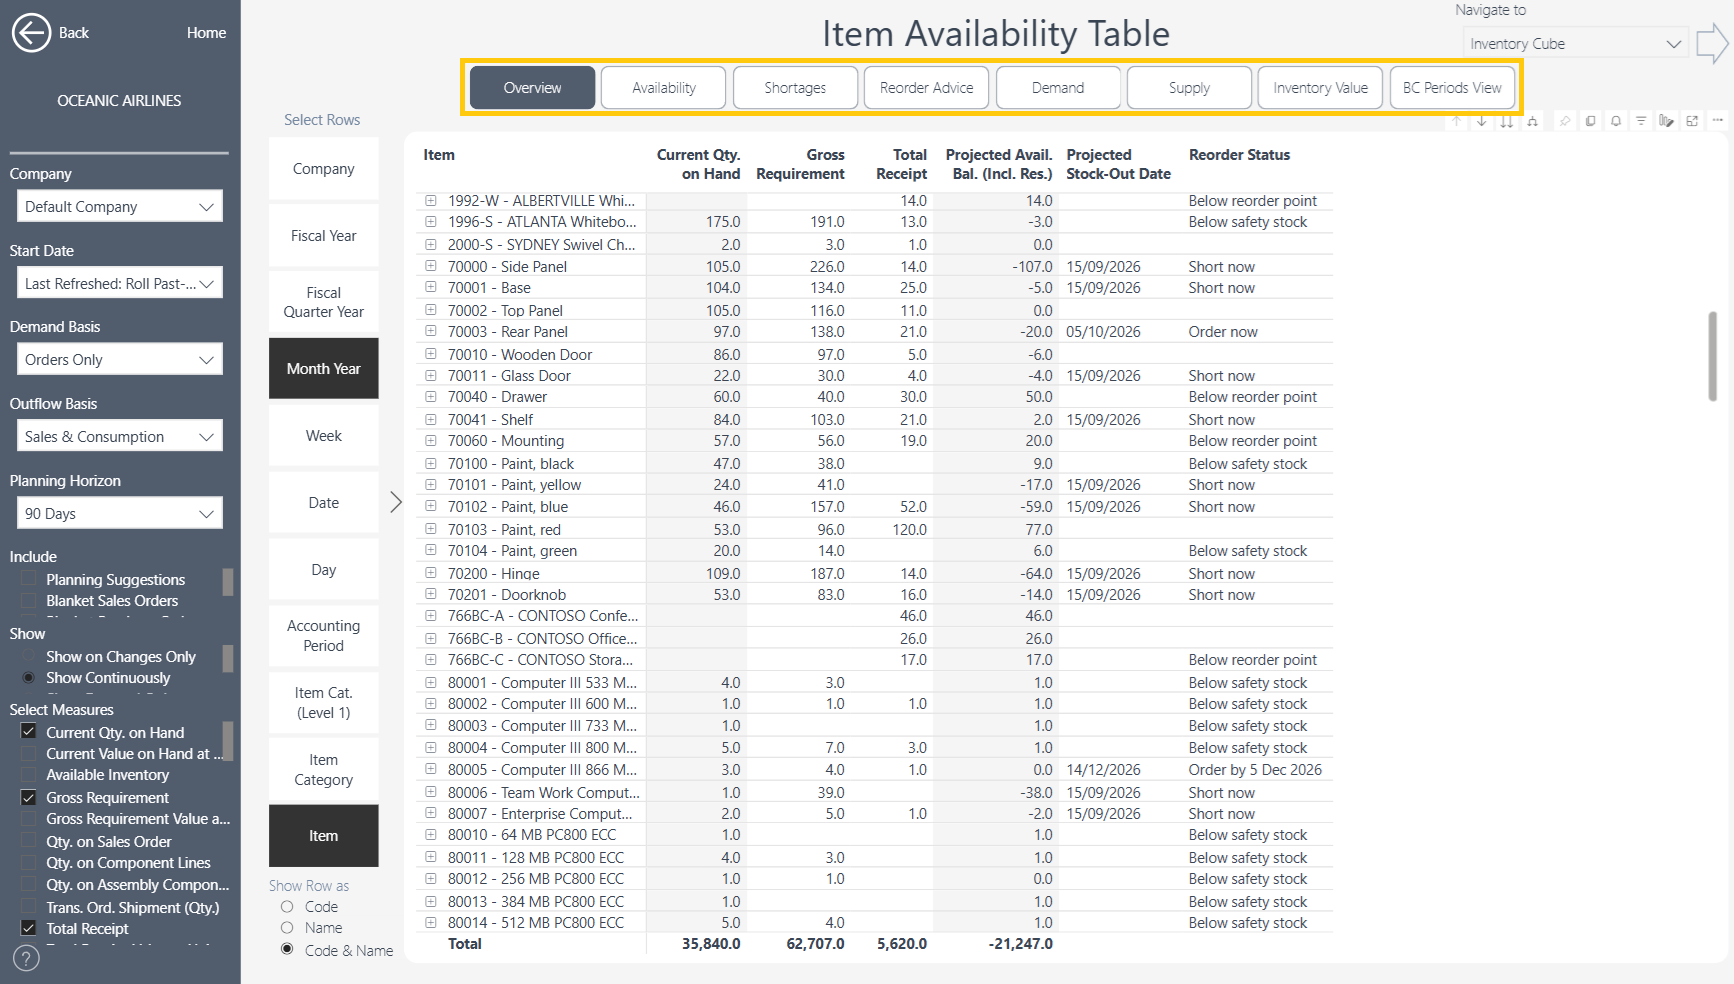
Tab | What it shows | Typical question | How to use it |
|---|---|---|---|
Overview | Current Qty. on Hand, Gross Requirement, Total Receipt, Projected Avail. Bal. (Incl. Res.), Projected Stock-Out Date and Reorder Status, one row per item. The report opens here; clicking it clears every slicer and filter and resets the columns and rows. | "What is the overall picture, with nothing filtered?" | Start here. Scan Projected Stock-Out Date and Reorder Status for anything flagged, then open the tab that explains it. Click Overview again to reset after filtering or drilling. |
Availability | Current Qty. on Hand, Available Inventory, Gross Requirement, Total Receipt, Projected Avail. Bal. (Incl. Res.); expand an item to months | "Where does each item stand, and does it stay positive?" | Watch Projected Avail. Bal. (Incl. Res.): a negative figure means the item runs short. Expand to months to see when it turns negative. Available Inventory below Current Qty. on Hand means stock is reserved. |
Shortages | Projected Stock-Out Date, Days to Stock-Out, Projected Shortage Qty., Projected Shortage Value at Unit Cost, Safety Stock Quantity – only items that run out, soonest first | "Which items run out, when, and how much is missing?" | Read top down – the most urgent item is first. Use Projected Shortage Value to prioritise and compare Shortage Qty. with Safety Stock Quantity. Suggested setting: Orders + L6M Avg. Outflow. Add Safety Stock Breach Date from Additional for an earlier warning. |
Reorder Advice | Reorder Status, Suggested Order Qty., Suggested Order Value at Unit Cost, Order By Date, Total Lead Time (Days), Next Expected Receipt Date – only items with advice, sorted by order-by date | "What should I order today, how much, and by when?" | Work down the list by Order By Date – a date today or earlier means order now. Check Next Expected Receipt Date first: an open order may already cover the gap. With SKUs, add Location as the second row level. |
Demand | Gross Requirement split by source: sales orders, production components, assembly components, transfer shipments, plus Projected Demand; by month, empty months hidden | "Where does the demand come from?" | Find the column that drives Gross Requirement, then right-click the item → Drill through → Inventory Events for the order lines. Project, service and return demand are under Additional. |
Supply | Total Receipt split by source: purchase orders, firm planned and released production orders, assembly orders, in transit, transfer receipts, planned order receipts; by month, empty months hidden | "What is already on order and when does it arrive?" | Compare the month each receipt lands with the month the balance turns negative on Availability. Planned Order Receipt is planning suggestions, not firm orders. Multi-site: add Location as the second row level to follow transfers. |
Inventory Value | Current Value on Hand at Unit Cost, Total Receipt Value, Gross Requirement Value, Projected Demand Value, Projected Inventory Value (Demand Basis), month by month | "How much cash is in stock now and over the coming months?" | Watch Projected Inventory Value month by month for build-ups ahead of demand. Use Orders + Forecast with a 365-day horizon. Switch rows to Item Category for a controller view. |
BC Periods View | Gross Requirement, Scheduled Receipt, Planned Order Receipt, Projected Available Balance, Planned Order Releases by week, planning suggestions included – matches BC's Item Availability by Periods line for line | "What does BC show, and does it reconcile?" | Use for reconciling with BC and support cases: set First Entry Date and Orders Only, then expand an item to Day to match BC line for line. |
Switching tabs never changes Start Date, Demand Basis or Planning Horizon – they stay as you set them, so the numbers you were just looking at don't move. Each tab's tooltip suggests the settings that suit it (for example Orders + L6M Avg. Outflow on Shortages and Reorder Advice, Orders + Forecast with a 365-day horizon on Inventory Value, First Entry Date and Orders Only on BC Periods View). Columns a tab doesn't show by default – reserved quantities, weeks of cover, project and service demand, quotes and blankets – are under Additional in Select Measures.
Two companion pages sit beside the table:
Item Availability by Period – items as rows, periods as columns, with a chart underneath. Its Seasonal Availability tab lays last year's outflow next to this year's projected demand and receipts, month by month.
Inventory Events – a drill-through list of the individual document lines (order number, line, date, quantity) behind any cell. Right-click an item and choose Drill through to open it.
Every tab uses the same table: click + in front of an item to expand it to the periods chosen under Select Rows, and use Select Measures to add or remove columns.
The filters on the left
The left pane holds five drop-downs, three option lists and the row selector. The drop-downs decide how the projection is calculated; the lists decide what you see.
Company
The Business Central company to show. Item numbers can repeat across companies, so pick one company before comparing items. Locations, item categories and other slicers are in the filter pane on the right.
Start Date
Decides what happens to open documents that are already overdue (dated before the refresh date).
Option | What it does | When to use it |
|---|---|---|
First Entry Date | Shows every open line on its own date, including past months. The projected balance runs from the first entry. | Reviewing history, or checking why a balance looks wrong |
Last Refreshed: Skip Past-Due | Ignores lines dated before the refresh date. Only supply and demand from today onwards count. | "Assume overdue orders will never happen" – a cautious view of supply, an optimistic view of demand |
Last Refreshed: Roll Past-Due | Moves every overdue line into the refresh date, so it still counts, on day one. This is the default on the table and matches BC's before column on Item Availability by Periods. | Day-to-day planning: overdue purchase orders still arrive, overdue sales orders still ship |
Under Skip and Roll Past-Due the periods before the refresh date are blank – nothing is hidden, it has simply been moved forward.
Demand Basis
Adds a second demand stream on top of open orders. It only affects the Demand Basis measures (projected balance, cover, shortages, reorder advice); Gross Requirement and Total Receipt never change.
Option | Extra demand added | Best for |
|---|---|---|
Orders Only | None – open documents only | Short horizons, make-to-order |
Orders + Forecast | The BC demand forecast, after forecast consumption (forecast already covered by orders is not counted twice) | Companies that maintain a demand forecast in BC |
Orders + Sales Budget | The item sales budget (Item Budget Name slicer), for future months | Companies that budget sales by item |
Orders + L6M Avg. Outflow | Average daily outflow of the last 6 complete months, projected forward | Stable, recent demand – the usual choice for reorder advice |
Orders + L12M Avg. Outflow | Average daily outflow of the last 12 complete months | Smoother, slower-moving items |
Orders + Prior-Year Outflow | The outflow of the same days one year ago | Seasonal items |
For the budget, average and prior-year options the extra demand is netted against the open orders of each month, so a month that already has sales orders for most of its plan only adds the remainder. The forecast option uses BC's own netting.
Outflow Basis
Defines what "outflow" means for the average and prior-year demand options, the cover measures and the Outflow (Qty.) columns: Sales (shipments to customers), Consumption (production), Assembly Consumption, or Sales & Consumption (all three, the default). Choose Sales for finished goods, Consumption for raw materials, and the default for items that are both sold and used in production.
Planning Horizon
How far ahead the shortage and reorder calculations look: 30, 60, 90, 120, 180 or 365 days from the refresh date. A stock-out projected after the horizon is not reported. 90 days is a good working default with the L6M basis; use 365 with the forecast or budget basis.
It affects only the Projected Shortages and Reorder Advice measures (stock-out, safety stock and reorder point breach dates, days to stock-out / reorder point, shortage quantity and value, balance at horizon, reorder status, suggested order quantity and value, order-by date) and, on the Forecast, Sales Budget and Prior-Year bases, the daily demand rate behind Days / Weeks / Months of Cover (Demand Basis). Gross Requirement, Total Receipt, Projected Demand and the projected balances never change with the horizon.
Include
Adds document types that Business Central does not count by default. Tick one to add it to Gross Requirement or Total Receipt – and therefore to the projected balance.
Planning Suggestions – lines created by a planning run in the requisition or planning worksheet (BC's Include Planning Suggestions). Manually entered worksheet lines are always included.
Blanket Sales Orders – the part of blanket orders not yet released to sales orders. As in BC these count as forecast: they reduce Forecasted Projected Inventory and the Orders + Forecast basis, not the plain projected balance.
Blanket Purchase Orders, Sales Quotes, Purchase Quotes – open quotes and blanket purchase lines, for a what-if view.
Show
Controls which period rows appear when an item is expanded: Show on Changes Only lists only the periods with a supply or demand event (BC's by Event view); Show Continuously (default) lists every period and carries the balance forward. Two more options, Demand Only and Supply Only, are available in the filter pane.
Select Measures
The columns of the table. Each tab pre-selects its own set; tick or untick to change it. The list is long, so it is grouped: Available Inventory, Gross Requirement, Total Receipt, Scheduled Receipt, Planned Order Receipt, Projected Available Balance, Planned Order Releases, Projected Demand, Projected Shortages, Reorder Advice, Item Outflows and Item fields. The next section explains them.
How the numbers fit together
Every projected balance is built the same way, and it is the same arithmetic Business Central uses:
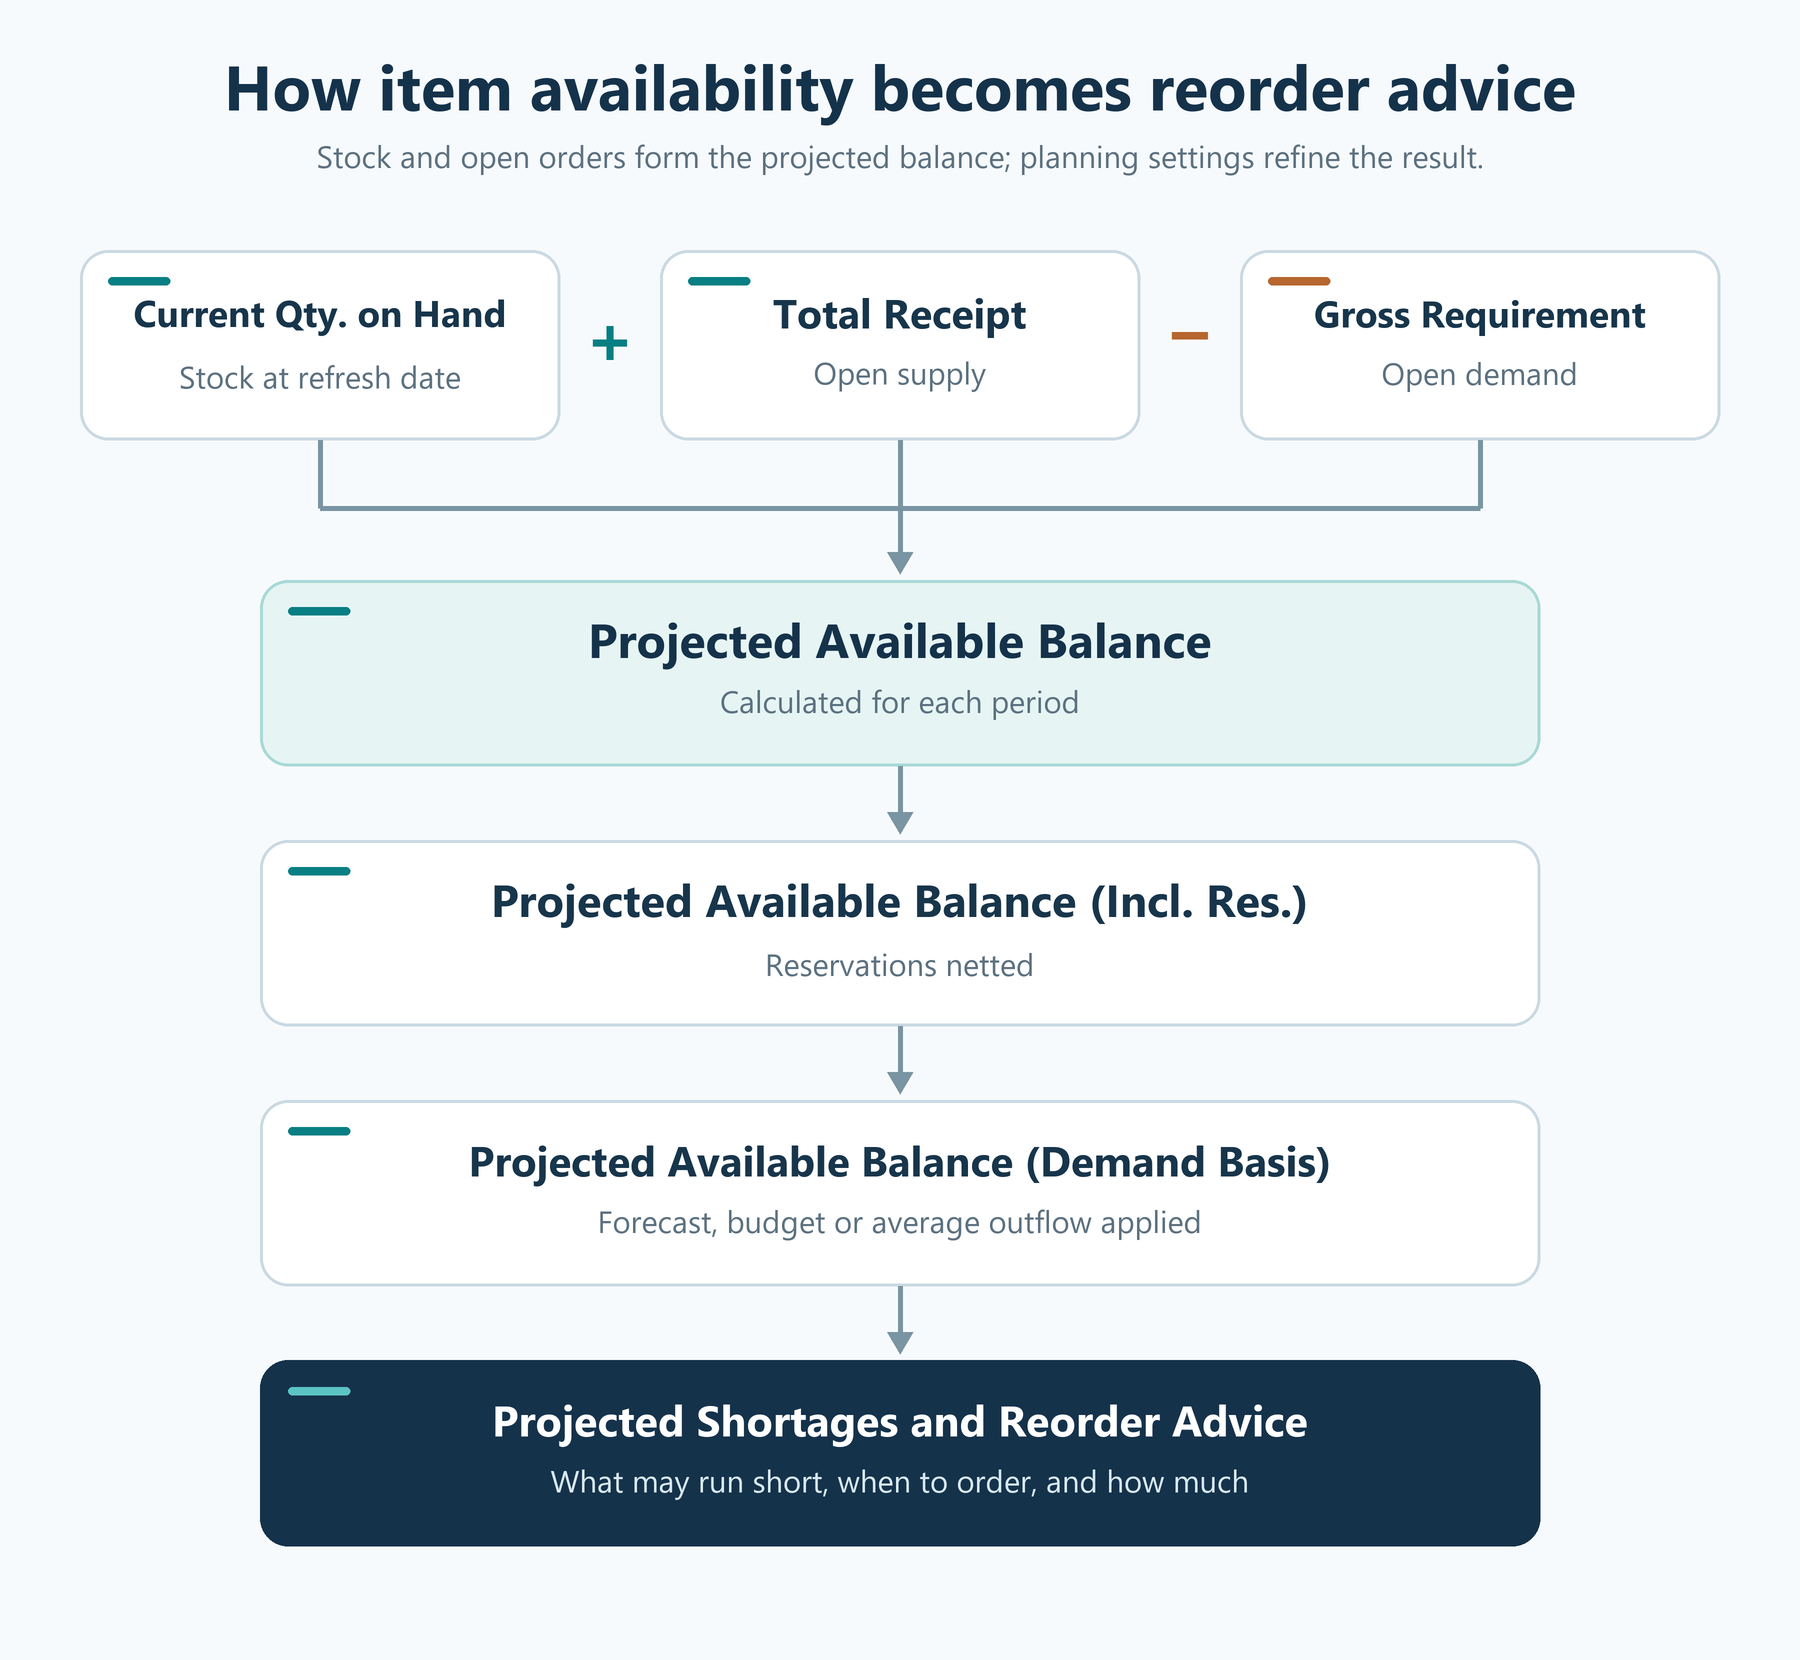 Read left to right: stock on hand today, plus everything on order, minus everything promised, gives the plain projected available balance (PAB). Netting reservations turns it into the quantity that is free to promise. Adding the demand stream chosen in Demand Basis gives the balance the shortage dates and reorder advice are calculated from.
Three conventions apply throughout:
Quantities are in the item's base unit of measure (pieces, kg, litres – whatever the item card says).
A measure without "Balance" in its name is the amount for that period; "… Balance" is the running total up to the end of the period. Expand an item to months and Gross Requirement shows September's demand, Gross Requirement Balance shows all demand up to the end of September.
Values "at Unit Cost" use the item card's Unit Cost (standard cost for standard-costed items, average cost otherwise). This keeps stock, receipts, demand and the projected balance on one cost basis so they add up. It is not the sales price and not the ledger valuation – see Valuation Gap for the difference.
Key measures
The measures are listed in the order of the Select Measures groups. Most groups have a total, a Balance (running total), a Value at Unit Cost twin, and one line per document type. Reserved (Res. Qty. on …) columns show how much of that line is already reserved for a specific order.
Available Inventory
Measure | Meaning |
|---|---|
Current Qty. on Hand | Stock on hand at the refresh date, excluding in-transit locations. The starting point of every projection; the same value in every period. |
Reserved Qty. on Inventory | Part of that stock already reserved for specific sales orders, production orders or transfers. |
Available Inventory | Current Qty. on Hand minus Reserved Qty. on Inventory – the stock you can still promise. |
Current Value on Hand at Unit Cost | Current Qty. on Hand valued at the item card Unit Cost. |
Available Inventory Value at Unit Cost | Available Inventory valued at the item card Unit Cost. |
Current Value on Hand | The same stock valued on the ledger (invoiced plus expected cost). |
Valuation Gap (Unit Cost vs Ledger) | Ledger value minus Unit Cost value. Zero for standard-cost items; for FIFO/average items a difference means Adjust Cost – Item Entries has not run or the item card cost is stale. |
Gross Requirement (demand)
Gross Requirement is all open demand in the period: sales orders (by Shipment Date), transfer shipments, production and assembly components, planning components, project and service lines, purchase returns. It is shown as a positive number. Reserved Requirement is the reserved part of it.
Line | Source document | Dated by |
|---|---|---|
Qty. on Sales Order | Open sales order lines (drop shipments excluded) | Shipment Date |
Qty. on Sales Quote | Open sales quotes – only with Include: Sales Quotes | Shipment Date |
Qty. on Sales Blanket Order | Blanket lines not yet released – forecast, only with Include: Blanket Sales Orders | Shipment Date |
Qty. on Purch. Return | Purchase return orders (goods going back) | Expected Receipt Date |
Trans. Ord. Shipment (Qty.) | Outbound leg of transfer orders, at the shipping location | Shipment Date |
Qty. on Component Lines | Components of planned, firm planned and released production orders | Due Date |
Qty. on Assembly Component | Components of assembly orders | Due Date |
Planning Issues (Qty.) | Components of manually entered planning worksheet lines | Due Date |
Planning Suggestion Issues (Qty.) | Components of planning-run lines – only with Include: Planning Suggestions | Due Date |
Qty. on Project Order | Project (job) planning lines | Planning Date |
Qty. on Service Order | Service order lines | Needed by Date |
Sales Order Value at Unit Cost and Gross Requirement Value at Unit Cost value these quantities at the item Unit Cost, not at sales price.
Total Receipt (supply)
Total Receipt is all open supply in the period. It is the sum of two classes, exactly as in BC:
Scheduled Receipt – firm supply: purchase orders, sales return orders, inbound transfers (both still-to-ship and already in transit), firm planned and released production orders, assembly orders. Add blanket purchase orders and purchase quotes with the Include options.
Planned Order Receipt – supply that is planned but not yet firm: planned production orders and requisition / planning worksheet lines (planning-run lines only with Include: Planning Suggestions).
Line | Source document | Dated by |
|---|---|---|
Qty. on Purch. Order | Open purchase order lines (drop shipments excluded) | Expected Receipt Date |
Qty. on Purch. Quote / Purch. Blanket Order | Only with the matching Include option | Expected Receipt Date |
Qty. on Sales Return | Sales return orders (goods coming back) | Shipment Date |
Trans. Ord. Receipt (Qty.) | Inbound leg of transfer orders not yet shipped | Receipt Date |
Qty. in Transit | Transfer lines already shipped, not yet received | Receipt Date |
Firm Planned / Released Prod. Order Receipt (Qty.) | Output of firm planned and released production orders | Due Date |
Qty. on Assembly Order | Output of assembly orders | Due Date |
Planned Prod. Order Receipt (Qty.) | Output of planned production orders | Due Date |
Qty. on Req. Line | Manually entered requisition / planning worksheet lines | Due Date |
Qty. on Planning Suggestion | Planning-run worksheet lines – only with Include: Planning Suggestions | Due Date |
Next Expected Receipt Date is the earliest expected receipt date of an open purchase order on or after the refresh date. Reserved Receipt is the part of Total Receipt already reserved for a specific demand.
Projected Available Balance
Projected Available Balance, abbreviated PAB, is the standard MRP / APICS term for the balance projected after all scheduled supply and demand; Business Central uses the same name. The three PAB columns differ only in what is netted out.
Measure | Meaning |
|---|---|
Projected Avail. Bal. | On hand + supply − demand, cumulative per period. BC's Projected Available Balance; reservations not netted. |
Projected Avail. Bal. (Incl. Res.) | The same with reservations taken out of stock, supply and demand – the quantity truly free to promise. |
Projected Avail. Bal. (Demand Basis) | The (Incl. Res.) balance minus the extra demand stream chosen in Demand Basis. With Orders Only it equals (Incl. Res.). All shortage and reorder measures are calculated from this balance. |
Forecasted Projected Inventory | Fixed on Orders + Forecast, whatever the slicer says – BC's Forecasted Projected Inventory. |
Projected Inventory Value at Unit Cost (Demand Basis) | The Demand Basis balance valued at the item Unit Cost. |
A negative balance means a shortage in that period. On a total row the balance is the sum over items, which is only meaningful for the item's own rows and location sub-totals.
Projected Demand
Measure | Meaning |
|---|---|
Forecast Quantity | The BC demand forecast still open after consumption by orders, per forecast period. |
Sales Budget (Qty.) / (LCY) | The item sales budget for the selected budget name. |
Projected Demand (Qty.) | The extra demand the selected Demand Basis adds on top of open orders, per period, after netting. Blank with Orders Only. |
Projected Demand (Qty.) Balance | Running total of Projected Demand. |
Projected Daily Outflow (Qty.) L6M / L12M | How much of the item left the warehouse per day, on average, over the last 6 / 12 complete months – shipments to customers, production consumption, assembly consumption or all three, as set in Outflow Basis. This daily rate, multiplied by the days in each future period, is the demand assumed by the Orders + L6M / L12M Avg. Outflow options. Same figure in every period. |
Days / Weeks / Months of Cover (Demand Basis) | How long PAB (Demand Basis) at the end of the period lasts at the selected demand rate. 0 when the balance is already negative. |
Projected Shortages
Measure | Meaning |
|---|---|
Projected Stock-Out Date | The first day the Demand Basis balance – PAB (Demand Basis) – drops below zero within the Planning Horizon. Equals the refresh date if the item is already short. Blank if no shortage. |
Days to Stock-Out | Days from the refresh date to that day; 0 if already short. |
Projected Shortage Qty. | The deepest shortfall within the horizon – the quantity needed to keep the balance at or above zero. |
Projected Shortage Value at Unit Cost | That quantity at the item Unit Cost. |
Projected Safety Stock Breach Date | The first day PAB (Demand Basis) drops below the safety stock quantity. |
Projected Balance at Horizon | PAB (Demand Basis) on the last day of the Planning Horizon; negative = shortage still open. |
These are calculated per item, so they show on item rows (and item × location rows) and are blank on totals.
Reorder Advice
Measure | Meaning |
|---|---|
Reorder Status | Plain-language advice: Short now (already below zero), Order now (the stock-out is closer than the lead time), Order by … (a stock-out is coming, but the order can wait), Stock-out projected (no lead time), Below safety stock, Below reorder point. Blank when nothing is triggered. |
Suggested Order Qty. | One order that brings the lowest projected balance back to the level the item's reordering policy targets: Maximum Qty. → up to Maximum Inventory; Fixed Reorder Qty. → whole lots of Reorder Quantity; Lot-for-Lot, Order or blank → back to safety stock. Rounded to Minimum Order Quantity and Order Multiple. |
Suggested Order Value at Unit Cost | The suggested quantity at the item Unit Cost – the purchase commitment. |
Order By Date | Stock-out date minus total lead time – the last day to place the order. A date in the past means it is already late. |
Days to Reorder Point / Projected Reorder Point Breach Date | When PAB (Demand Basis) drops below the reorder point. |
Next Expected Receipt Date | The next open purchase order due. |
Planning Suggestion Value at Unit Cost | What BC's own planning run proposes, for comparison. |
The suggestion is a decision aid, not a replacement for BC's planning run: it sizes one order at today's low point and ignores lot accumulation, time buckets and dampeners.
Item Outflows
Outflow (Qty.) and Outflow Cost (LCY) are what actually left the warehouse in the period on the selected Outflow Basis. L4W and L12W are the last 4 and 12 weeks before the refresh date; Avg. Weekly Outflow L12W is the weekly usage planners compare with Weeks of Cover; PY is the same period one year earlier and is also shown for future months, which is what the Seasonal Availability tab uses.
Item fields
The planning parameters from the item card or the stockkeeping unit (the SKU value applies when a location is selected): Reordering Policy, Lead Time, Safety Lead Time, Total Lead Time, Safety Stock Quantity, Reorder Point, Maximum Inventory, Reorder Quantity, Minimum Order Quantity, Order Multiple and Unit Cost. Lead times in days require the current BCI Business Central extension; without it the lead-time columns and Order By Date are blank.
Worked example
The Item Availability by Event tab for the demo company, Start Date = Last Refreshed: Roll Past-Due, Demand Basis = Orders + L6M Avg. Outflow, Planning Horizon = 90 days:
Item | Gross Requirement | Reserved Requirement | Current Qty. on Hand | Reserved Qty. on Inventory | Total Receipt | Reserved Receipt | Projected Avail. Bal. (Incl. Res.) |
|---|---|---|---|---|---|---|---|
1000 Bicycle | 3 | 1 | 6 | – | 48 | 1 | 51 |
1110 Rim | 1,013 | 155 | 413 | 137 | 61 | 18 | −539 |
1120 Spokes | 37,431 | 3,954 | 12,492 | 3,954 | – | – | −24,939 |
Bicycle is fine: 6 on hand, 48 arriving from production and purchase orders, 3 to ship. The balance at the end of the horizon is 6 + 48 − 3 = 51. Reservations (1 on the requirement, 1 on the receipt) cancel out.
Rim is short: 413 on hand and 61 on order cannot cover 1,013 of open demand from production orders. The balance ends at −539. Expand the row to months to see in which month it turns negative, or open the Projected Shortages tab for the exact day and the Reorder Advice tab for the suggested order.
Spokes shows why the reservation columns matter: 3,954 of the 12,492 on hand are reserved, and the same 3,954 sit in Reserved Requirement – they are the same units, promised to specific production orders. The (Incl. Res.) balance nets both sides, so the shortfall of 24,939 is the unreserved position.
To see the documents behind any number, right-click the cell and choose Drill through → Inventory Events.
Tips and frequently asked questions
A good weekly routine for a purchaser: Reorder Advice tab, Roll Past-Due, Orders + L6M Avg. Outflow, 90-day horizon, Planning Suggestions off. Sort by Reorder Status, work the Short now and Order now items first, and use Order By Date for the rest.
Why is the balance blank for past months? The Start Date selector is set to Skip or Roll Past-Due, so everything before the refresh date has been moved to the refresh date. Switch to First Entry Date to see the history.
Why does the total row show a nonsense balance? A projected balance only makes sense per item. On category or company totals it is the sum of positive and negative item balances; use No. of Items with Projected Shortage or Projected Shortage Value on totals instead.
Why are the shortage and reorder columns blank on a row? They are calculated for one item at a time. Make sure the row is an item (or item × location) and that a company is selected.
Why don't my numbers match BC's Item Availability by Event? Check three things: the Start Date (BC shows overdue lines on their own date, which is First Entry Date here); the Include options (BC's Include Planning Suggestions and Include Blanket Sales Orders); and the location filter. With the same settings the plain Projected Avail. Bal. equals BC line for line.
Where is the demand forecast? Choose Orders + Forecast in Demand Basis, or add the Forecast Quantity column. It uses BC's remaining forecast after consumption by orders.
Why is Current Value on Hand different from Inventory Valuation? Item Availability values everything at the item card Unit Cost so quantities and values reconcile. The Inventory Valuation and Inventory Value pages use the ledger cost. Valuation Gap shows the difference per item.
Tables are slow with many columns. Each shortage or reorder column re-projects every item. Keep the default columns, filter to a category or location, or switch Select Rows from Date to Month Year.
Questions or suggestions about this guide? Contact us.