Inventory Aging & Inventory Activity Aging in Business Central

What these two reports tell you
Inventory Aging shows how long current stock has been held, while Inventory Activity Aging analyzes inventory according to recent sales and consumption activity.
Both reports answer one question every inventory manager asks: how much of our stock is old, and which items are no longer moving? They look at the same inventory from two different angles.
Inventory Aging ages the stock itself. Every quantity still on hand is traced back to the day it came into the warehouse, and its value is placed in an age bucket: received in the last 30 days, 31 to 60 days ago, and so on up to over 365 days. Use it to see how much money is tied up in stock that has been sitting for a long time.
Inventory Activity Aging ages the item. For every item it looks at the last time something happened to it — the last sale, the last purchase, the last consumption in production — and counts the days since then. Use it to find items that have gone unsold or unused the longest, even if their stock is recent.
The two views can disagree, and that is the point. An item received last month but not sold for two years is young on Inventory Aging and old on Inventory Activity Aging. Together they separate three situations:
Situation | Inventory Aging says | Activity Aging says | Typical action |
|---|---|---|---|
Healthy, fast-moving item | Young stock | Recent activity | None |
Over-stocked but still selling | Old stock | Recent activity | Reduce purchases, check reorder settings |
Dead or obsolete item | Old stock | No recent activity | Promote, write down, or dispose |
Both reports are refreshed together with the rest of Inventory Insights. Aging is always counted up to the last refresh date of the app, so the day counts are as current as the data.
Inventory Aging report
The Inventory Aging report shows the value of the stock you hold today, split by how long ago it was received. It answers: how much of our inventory value is more than 90, 180 or 365 days old — and where?
How the age of stock is calculated
Business Central keeps every receipt into inventory as an item ledger entry. When stock is sold or consumed, Business Central applies the outgoing quantity against the earliest open receipts (first in, first out). The report takes every receipt that still has a remaining quantity on hand and counts the days from its posting date to the last refresh date. That remaining quantity, valued at the item's current average unit cost, is placed in one of these buckets:
Bucket | Meaning |
|---|---|
Last 7 days | Received within the past week |
8 to 30 days | Received between one week and one month ago |
31 to 60 days | One to two months on hand |
61 to 90 days | Two to three months on hand |
91 to 120 days | Three to four months on hand |
121 to 180 days | Four to six months on hand |
181 to 365 days | Six months to a year on hand |
Over 365 days | On hand for more than a year |
Negative inventory | Stock that has been shipped or consumed before the receipt was posted; the quantity on hand is below zero |
All buckets together add up exactly to your total inventory value (invoiced and expected). Green columns in the chart are young stock, amber is getting old, and red is stock over a year old.
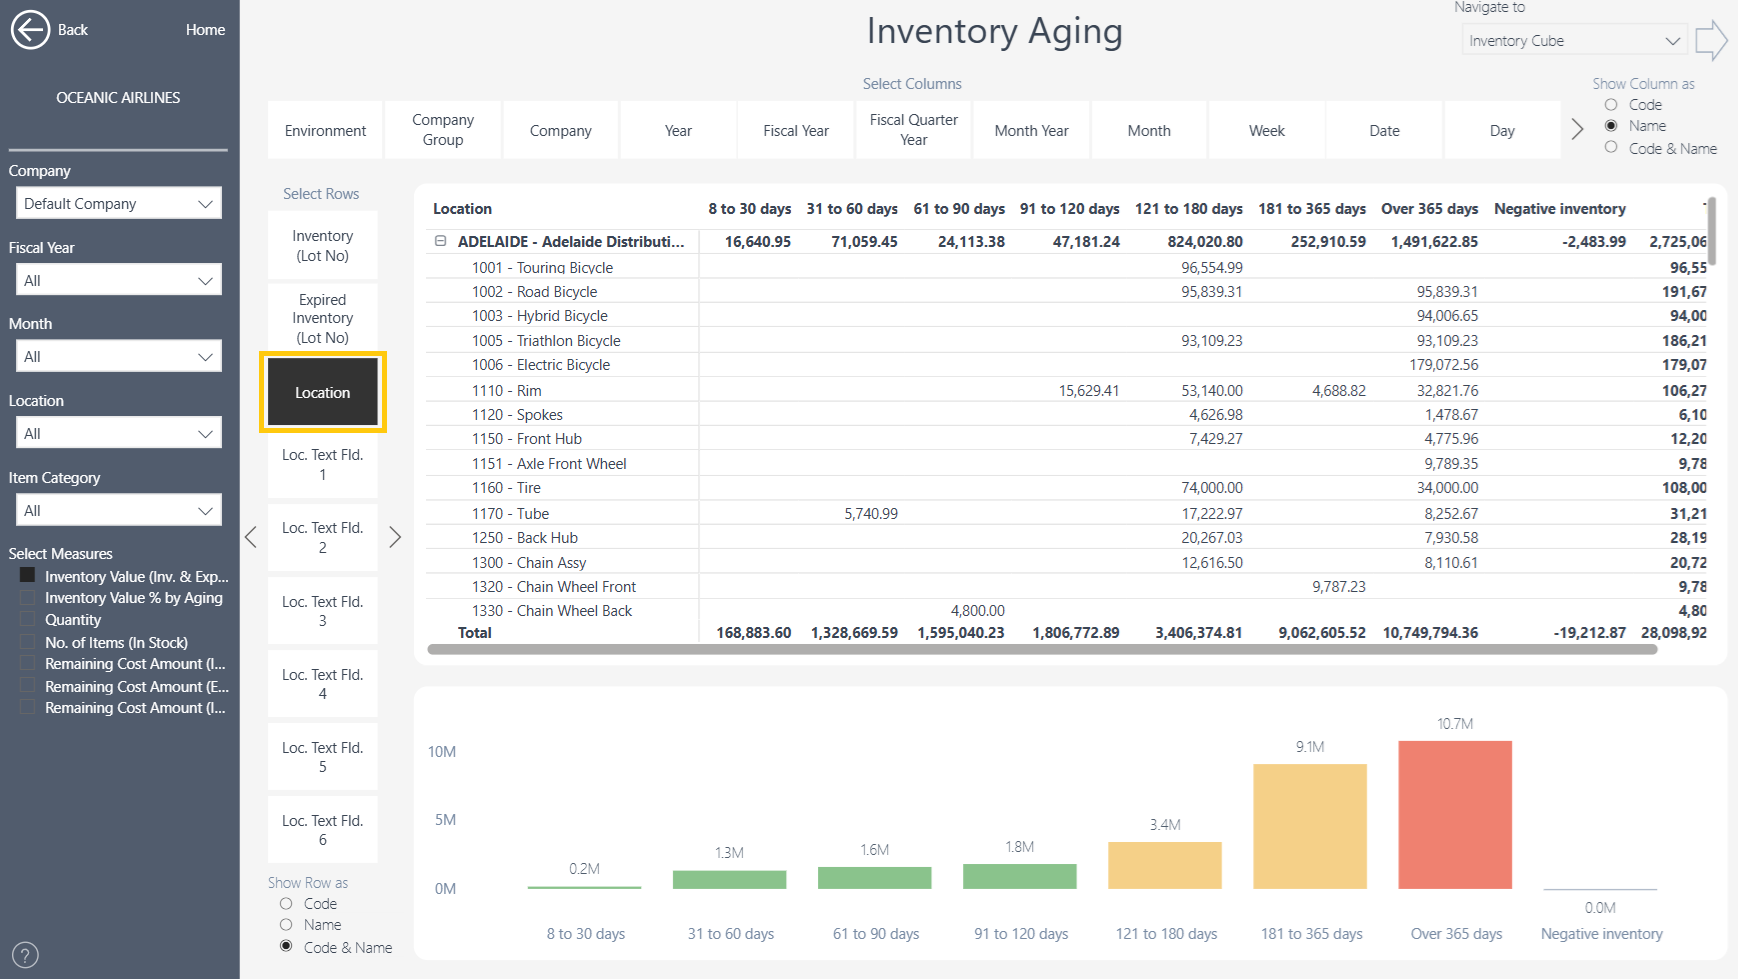
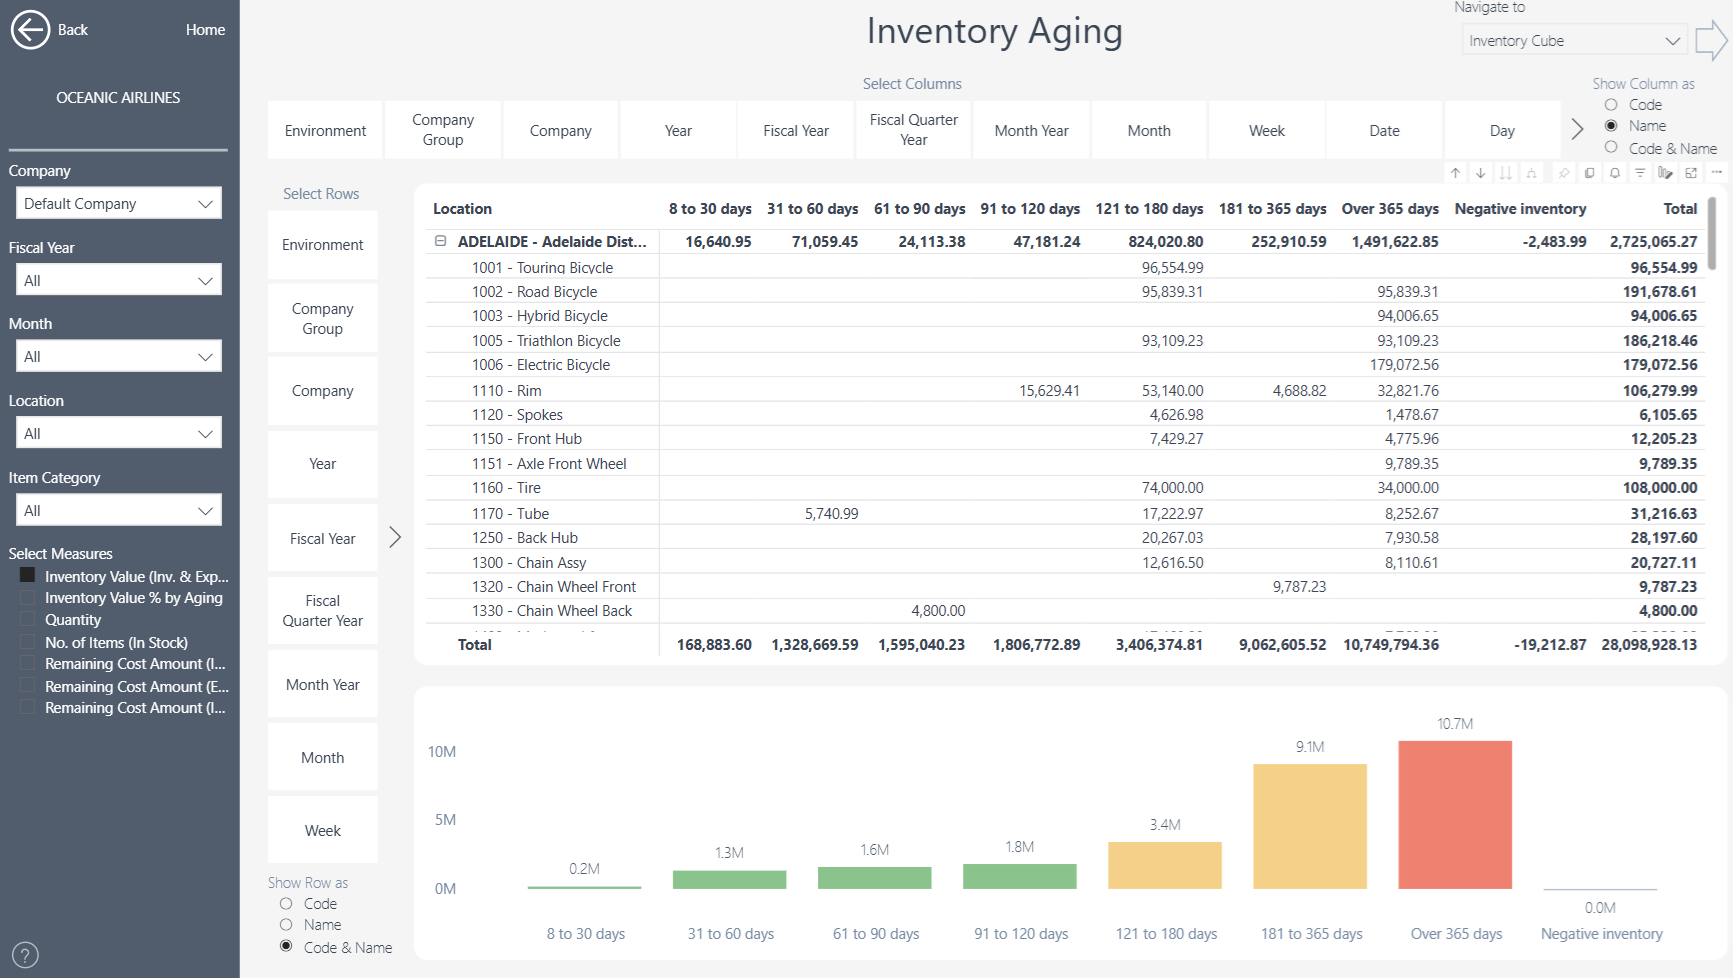 In the example screenshot, Oceanic Airlines holds 28.1 M of inventory in total. Less than 0.2 M was received in the last 30 days, while 10.7 M (38 %) has been on hand for more than a year and a further 9.1 M for six to twelve months. Two thirds of the inventory value is more than six months old — a clear signal to review purchasing on those items.
Reading the table
The table shows one row per location, item, or whatever you choose under Select Rows, and one column per aging bucket. Click the + / − sign at the start of a row to expand it: in the screenshot the ADELAIDE location is expanded to show the items stocked there. The Total row and the rightmost Total column give the overall picture.
The buttons above and beside the table change what the table shows:
Select Columns — puts a different dimension across the top instead of the aging buckets, for example Month Year or Fiscal Year. Choose Aging Group (the default, highlighted in dark grey) to see the age buckets.
Select Rows — chooses the row dimension: Company, Location, Item, Item Category, Production BOM, and so on.
Show Row as and Show Column as — display the Code, the Name, or both (for example 1001 - Touring Bicycle).
Select Measures — ticks which figures appear in each cell:
Inventory Value (Inv. & Expd.) — the value of the stock in that bucket. This is the default.
How it is calculated: for each item, the report first works out the current average unit cost — the item's total inventory value (invoiced & expected) divided by its total quantity on hand. It then multiplies the remaining quantity of every open receipt in the bucket by that average unit cost. Because every unit of an item carries the same cost, the buckets add up exactly to the total inventory value shown elsewhere in the app. The Remaining Cost Amount measures (available as additional columns) value each receipt at its own original cost instead, which can differ per layer and only reconciles after Adjust Cost – Item Entries has run in Business Central.
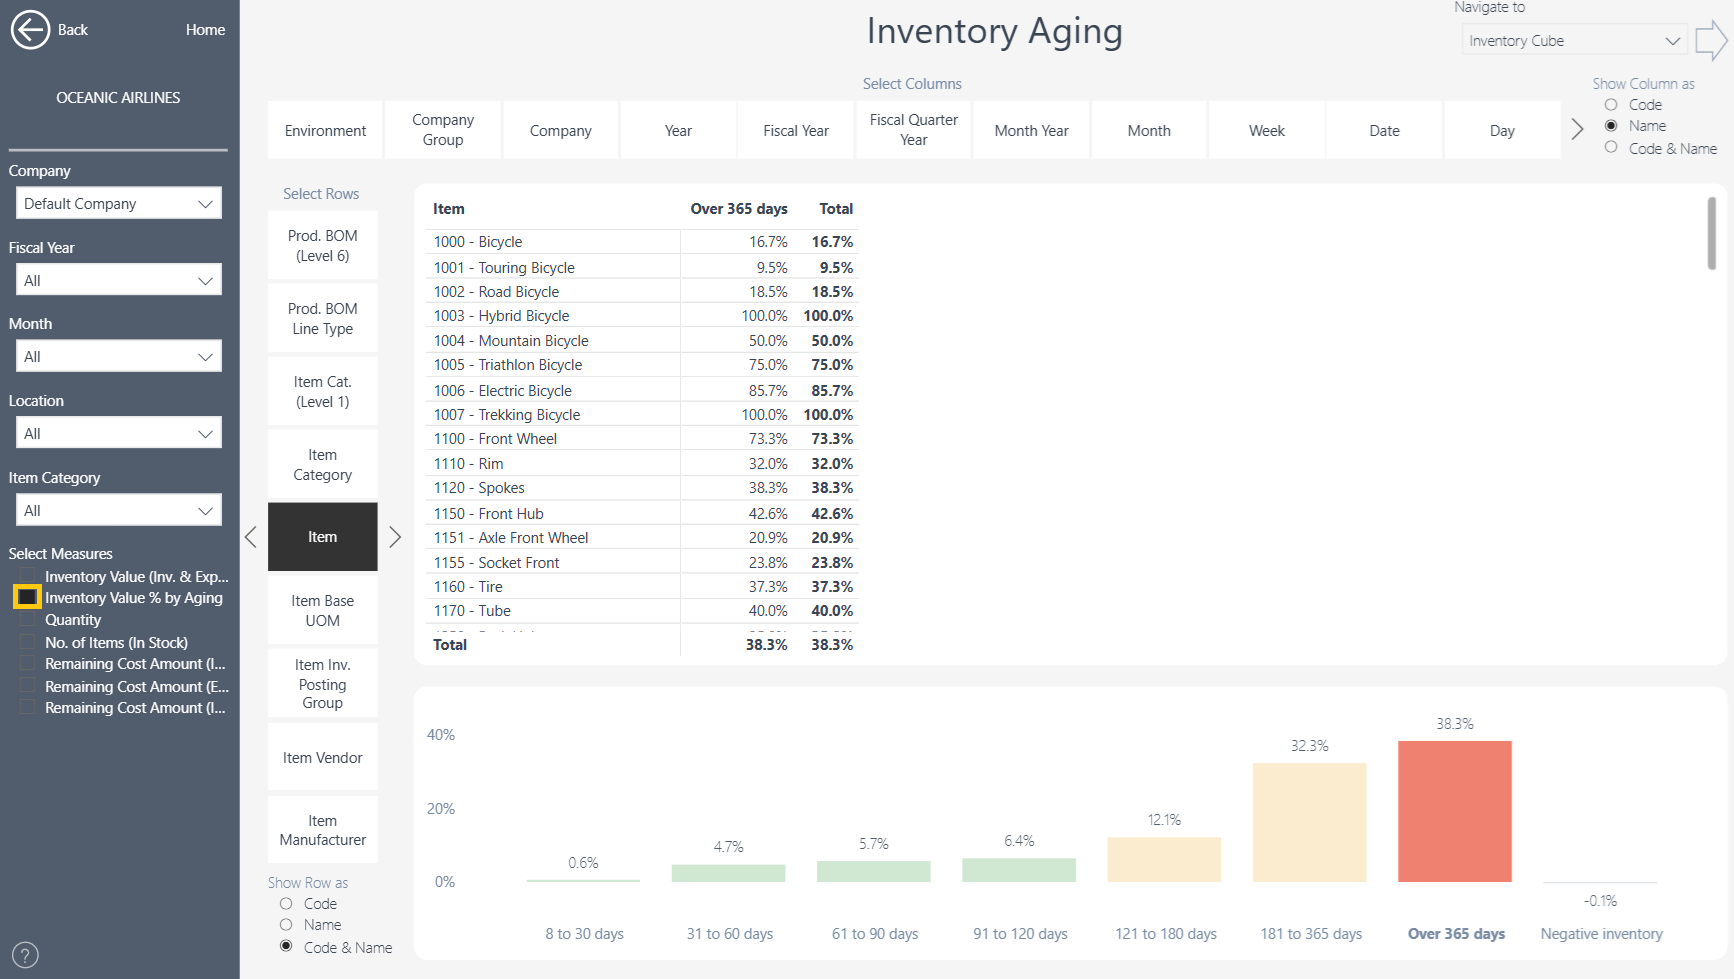
Inventory Value % by Aging — the same value as a percentage of the row's total, so you can compare an item or location against the company as a whole.
Quantity — the number of units (in the base unit of measure) rather than the value.
Reading the chart
The bar chart under the table repeats the buckets for whatever is currently selected in the table. Click a location or item row in the table and the chart updates to show only that selection; click it again to return to the total. Click a bar in the chart to filter the table to that bucket.
Inventory Activity Aging report
The Inventory Activity Aging report lists your items by how long it has been since they were last used. It answers the question printed at the top of the page: which items have gone unsold or unused the longest?
How activity age is calculated
For every item the report finds the posting date of its last activity — by default the latest of its last sale, last production consumption and last assembly consumption — and counts the days from that date to the last refresh date. This is the Days Since Last Item Sale & Consumption column. The item is then placed in an aging group using the same day ranges as the Inventory Aging report, plus one extra group:
Aging group | Meaning |
|---|---|
Last 7 days | Sold or used within the past week |
8 to 30 days … Over 365 days | Same ranges as Inventory Aging |
No transaction | The item has never had this kind of activity (for example never sold), or not since the history in the app begins |
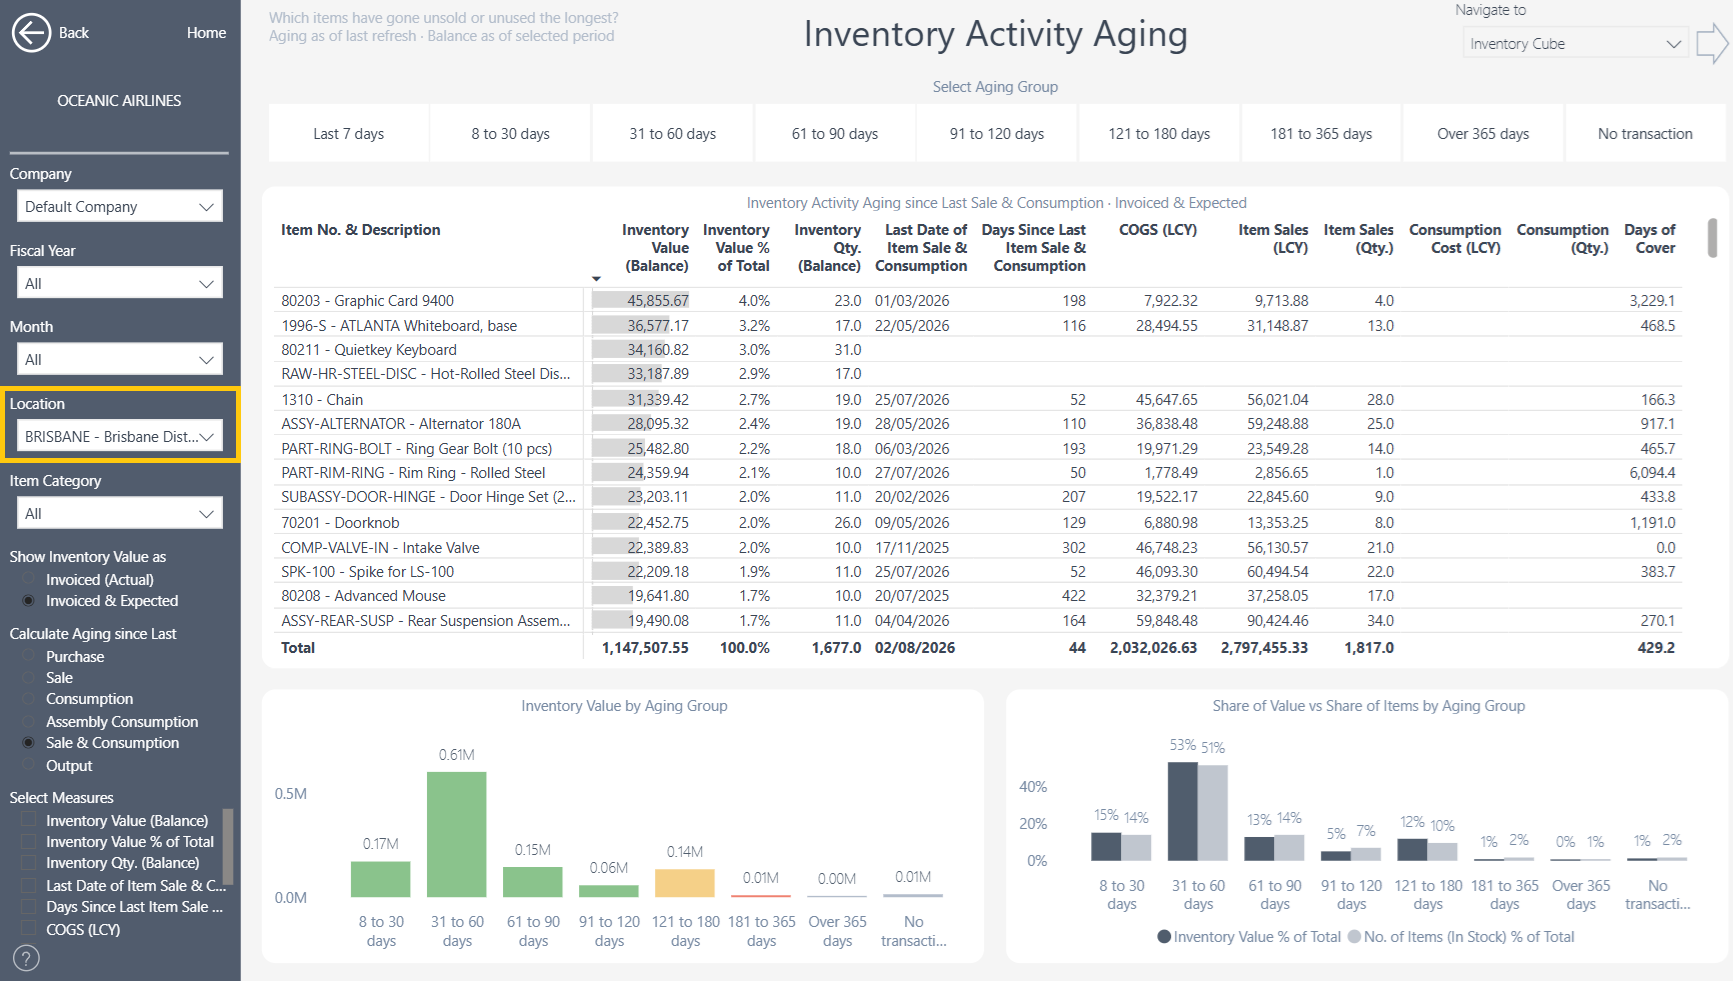
The subtitle Aging as of last refresh · Balance as of selected period summarises the two clocks in this report. The days since and the aging group are always counted up to the last refresh date and do not change when you pick another period. The inventory value and quantity columns show the balance at the end of the period selected in the Fiscal Year and Month filters. With All selected they show today's stock.
Reading the table
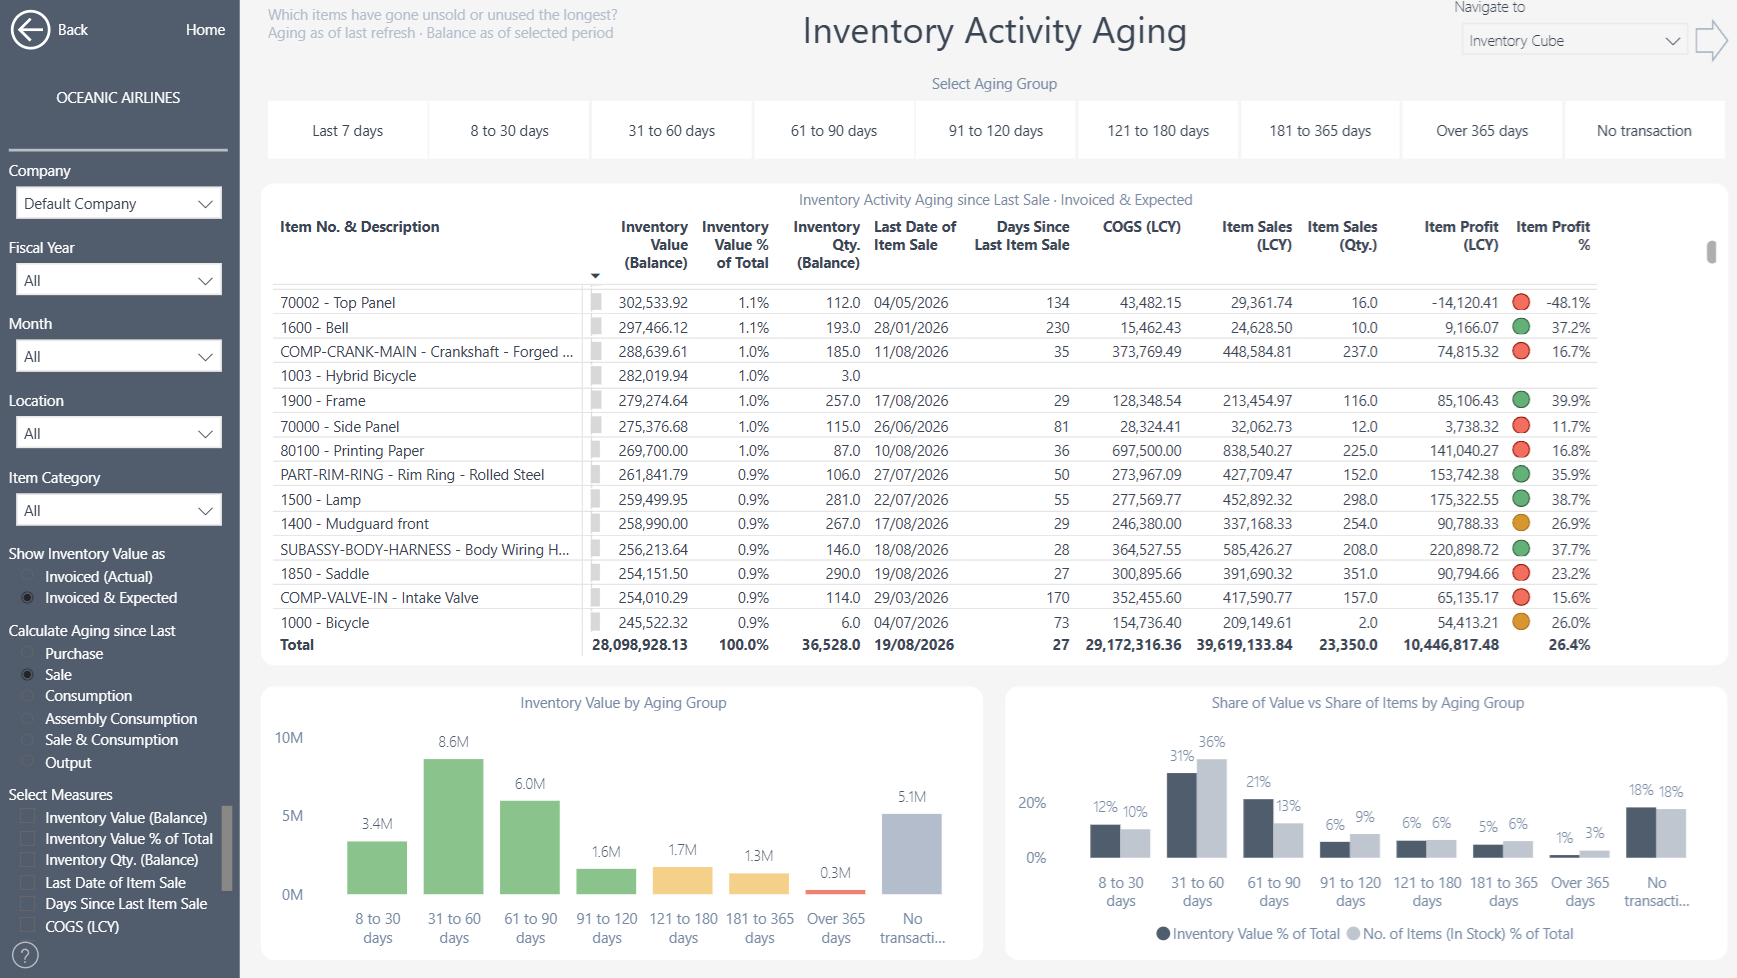 The table is sorted by inventory value, largest first, so the most expensive slow movers appear at the top. Use the Select Measures list in the left menu to add or remove columns; the full list of columns is explained in the Column reference section below.
Select Aging Group buttons
The row of buttons above the table — Last 7 days, 8 to 30 days … Over 365 days, No transaction — filters the table to one aging group. Click Over 365 days to list only the items with no sale or consumption in the past year; click No transaction to list items that have never been sold or used. Click the same button again to clear the filter and see all items.
Reading the two charts
Inventory Value by Aging Group shows how much inventory value sits in each group. In the example, 8.6 M is held by items last used 31 to 60 days ago, and 5.1 M by items with no transaction at all. Green groups are active items, amber and red are items that have not moved for four months or more, and grey is the No transaction group.
Share of Value vs Share of Items by Aging Group compares two percentages for each group: the dark bar is the group's share of total inventory value, the light bar its share of the number of items in stock. When the dark bar is taller than the light bar, a few expensive items dominate the group. When the light bar is taller, the group is made up of many low-value items.
Clicking a bar in either chart filters the table to that aging group, exactly like the buttons above the table.
The two main filters in the left menu
The left menu of the Inventory Activity Aging report has two option groups that change how the report is calculated. They are worth understanding before you use the report for decisions.
Show Inventory Value as
This option decides which cost is used for the inventory value columns. Business Central values inventory in two layers: cost that has been invoiced (the purchase invoice is posted) and cost that is only expected (the goods have been received, but the invoice has not arrived yet, or a production output has not been finished and costed).
Option | What is included | When to use it |
|---|---|---|
Invoiced (Actual) | Only invoiced cost. Goods received without an invoice count as zero value. | When you want to match the Business Central Inventory Valuation report with Include Expected Cost switched off, or the inventory G/L account. |
Invoiced & Expected (default on this page) | Invoiced cost plus the expected cost of receipts not yet invoiced. | When you want the value of everything physically on the shelf. This is the figure that matches the quantity on hand, which is why it is the default for aging. |
Switching the option changes the Inventory Value (Balance) and Inventory Value % of Total columns and the two charts; the days-since and quantity columns are not affected.
Calculate Aging since Last
This option decides which kind of activity the report counts days from. Every item has several "last dates", one per type of transaction, and the right one depends on what the item is for.
Option | Days are counted since the item's last… | Use it for |
|---|---|---|
Purchase | Purchase receipt | Seeing how long ago stock was last bought — useful for items you buy in, to spot items you keep receiving even though they are not moving out. |
Sale | Invoiced sale to a customer | Finished goods and trade items sold to customers. |
Consumption | Consumption on a production order | Raw materials and components used in manufacturing. |
Assembly Consumption | Consumption on an assembly order | Components used in assembly (kitting). |
Sale & Consumption (default) | Whichever is latest of Sale, Consumption and Assembly Consumption | Any item, regardless of whether it is sold or used internally. This is the safest choice when your inventory mixes finished goods and components. |
Output | Production output | Items you manufacture — shows how long ago the item was last produced. |
When you change the option, three things change together:
The Last Date of Item … and Days Since Last Item … columns switch to the chosen activity type.
Every item moves to the aging group that matches its new day count, so the Select Aging Group buttons and both charts are recalculated.
The No transaction group now means "never had this activity". A purchased component that has never been sold sits in No transaction under Sale, but in an active group under Consumption.
A good habit is to run the report twice: once on Sale for your finished goods (filter by Item Category) and once on Consumption for your components.
Column reference — Inventory Activity Aging table
All columns can be switched on or off in Select Measures in the left menu. Amounts are in local currency (LCY); quantities are in the item's base unit of measure.
Column | What it shows |
|---|---|
Inventory Value (Balance) | Inventory value at the end of the selected period, valued according to Show Inventory Value as. |
Inventory Value % of Total | The item's share of total inventory value. On the Total row and in the charts it is the aging group's share. |
Inventory Qty. (Balance) | Quantity on hand at the end of the selected period. |
Last Date of Item Sale & Consumption | Posting date of the item's most recent sale, consumption or assembly consumption, whichever is latest. The column follows the Calculate Aging since Last option (for example Last Date of Item Purchase). |
Days Since Last Item Sale & Consumption | Days from that date to the last refresh date. Blank when the item never had that activity. Also follows the Calculate Aging since Last option. |
COGS (LCY) | Cost of goods sold in the selected period, including item charges applied to sales. |
Item Sales (LCY) | Invoiced sales amount in the selected period, excluding VAT. |
Item Sales (Qty.) | Invoiced sales quantity in the selected period. |
Consumption Cost (LCY) | Cost of the item consumed by production orders in the selected period. |
Consumption (Qty.) | Quantity consumed by production orders in the selected period. |
Assembly Consumption Cost (LCY) / (Qty.) | The same for assembly orders. |
Output Cost (LCY) / Output (Qty.) | Cost and quantity of the item produced on production orders in the selected period. |
Purchase Cost (LCY) | Cost of the item purchased in the selected period, including item charges. |
Days of Cover | How many days the current stock would last at the average daily outflow (sales and consumption) of the last 12 months. Blank when there was no outflow. |
Months of Cover | Days of Cover divided by 30.44. |
Two columns deserve a second look when you review slow movers:
Days of Cover puts the days-since figure into context. An item last sold 73 days ago with 1,551 days of cover (item 1002 in the screenshot) is a much bigger concern than one last sold 73 days ago with 40 days of cover.
COGS (LCY) and Item Sales (LCY) over the last twelve months (set Fiscal Year to the current year, or leave All) tell you whether the item still earns money. A large inventory value with small sales is the classic excess-stock pattern.
The flow columns — COGS, sales, consumption, output and purchases — follow the Fiscal Year and Month filters. The days-since and days-of-cover columns do not; they are always calculated up to the last refresh date.
Step-by-step walkthroughs
Find the stock that has been on the shelf for more than a year
Open Inventory Aging and leave Fiscal Year and Month on All.
Under Select Rows choose Item; under Select Measures keep Inventory Value (Inv. & Expd.) ticked.
Click the Over 365 days column header to sort the table by that column, largest first.
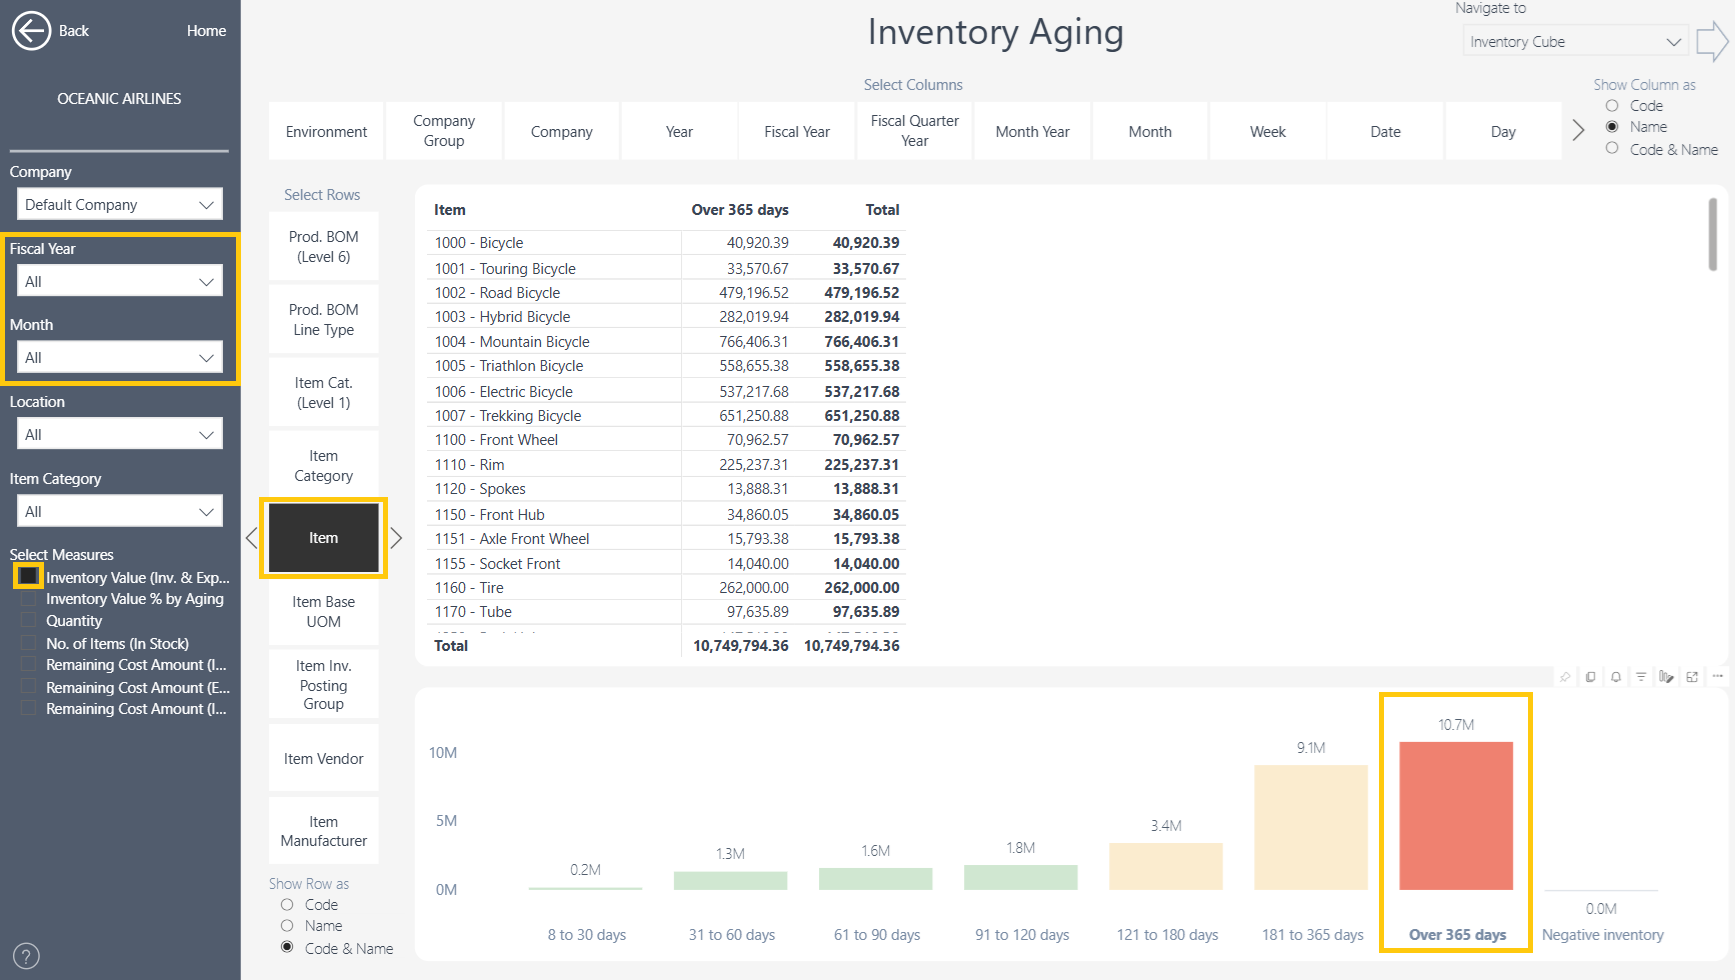 4. Tick Inventory Value % by Aging to see, for each item, what share of its stock is over a year old. An item with 100 % in that column has received nothing new in a year.
 5. Optionally set the row to Location group by warehouses to plan a stock-take or clearance there.
Find items that have stopped selling
Open Inventory Activity Aging and set Calculate Aging since Last to Sale (or keep Sale & Consumption if your items are also used in production).
Click the Over 365 days button above the table, then the No transaction button using ctrl or cmd: together these are your candidates for obsolete stock.
Tick Days of Cover and COGS (LCY) in Select Measures. Items with high inventory value, high days of cover and no COGS are the ones to act on first.
Use Item Category to review one product family at a time.
Separate over-stock from dead stock
On Inventory Activity Aging, click 8 to 30 days or 31 to 60 days: these items are still selling.
Sort by Days of Cover. Items near the top are selling, but you hold far more than you need — reduce purchasing or adjust the reorder point in Business Central rather than clearing them.
Switch to the Over 365 days and No transaction groups for the items that need clearance, promotion or write-down.
Review one warehouse
On Inventory Aging in Select Rows set the first row as Location, then choose Item holding ctrl or cmd to add another layer of hierarchy to see the aged stock at each location.
 2. On Inventory Activity Aging the days-since figures remain company-wide (an item last sold from another warehouse still counts as active), while the value and quantity columns show only the stock at a chosen location by using the drop down filter on the left.
As always, please share your feedback with us. We are continually improving our apps and will do our best to include your suggestions in future releases.